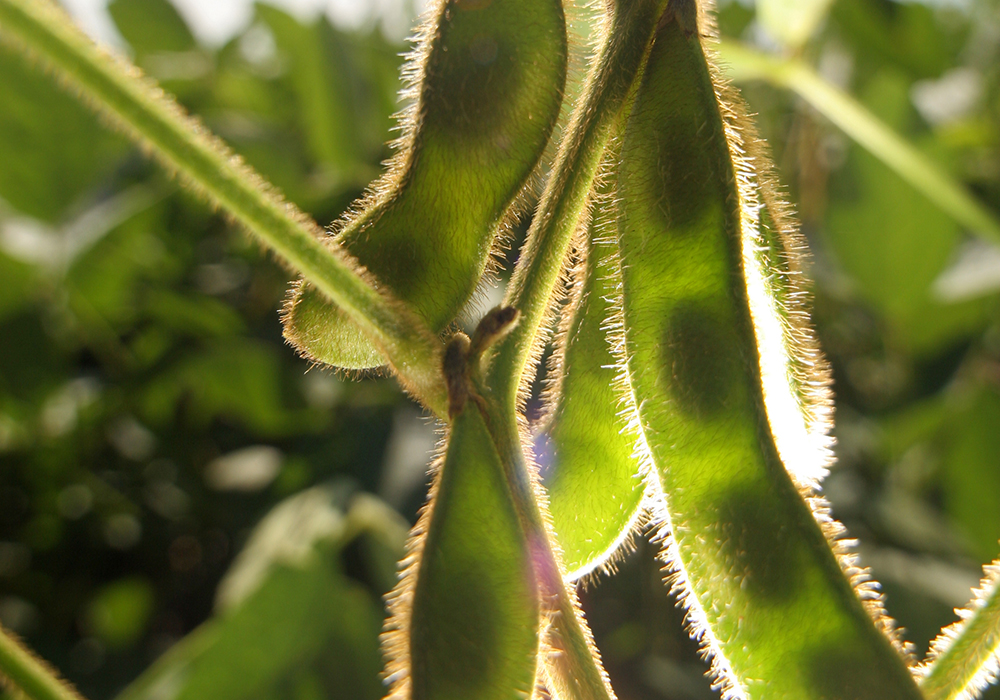
Despite soybean’s retreat, canola remained in positive territory. The bigger oilseed has remained in surplus as the Sino-American trade frictions wear on. Monday’s USDA crop condition report put half the American crop in good-to-excellent range, 35 percent in fair and 12 percent in poor-to-very-poor condition.
The American soybean crop has seen significant weather delays. USDA puts 40 percent in the blooming stage at the moment, while the five-year average is 66 percent and in 2018 it was over 75 percent at this point in the annual calendar.
Canola across Western Canada is also weather-delayed due to dry conditions at seeding and cold weather after the germination that had taken place in mid-May.
Read Also

U.S. market can’t easily be replaced
The deputy chief economist of Farm Credit Canada says 92 per cent of Canada’s total exports to the U.S. went into the country duty-free in June.
The ICE futures price for November settled at $447.80, up 80 cents per tonne. January was up $1.30 at $455.20, March up $1.10 at $462 and May $1.50 at $468.20. July 2020 contract ended the day at $473, up $1.30.
Wheat was flat on the day’s trading in Chicago and that translated into level prices back in the elevator bids on the Prairies.
The USDA rated American spring wheat condition Monday at 66 percent good to excellent and 20 percent fair, while four percent was rated poor. That was flat to a week ago’s crop condition report.
Corn improved slightly, with September trading on Chicago markets at US$4.25-50, up 3.25 cents per bushel.
Live and fed cattle were flat to up slightly, with October pit trades up 72 cents to 109.88 and feeders up three cents to $142.68. Lean hogs for October were up $2.60 to $81.80.
The Canadian dollar fell again today, down very slightly to 76.14 cents compared to its American cousin.
In Western Canadian elevator bids canola was up about 50 cents per tonne, in a range of $415 to $427 depending on the region.
Yellow peas were ranged from $219 to $246 outside Manitoba locations, where bids were $203 in the east and $208 in the west.
| Name / Contract | High | Low | Last | Change | Settlement |
| Canola Nov 2019 (updated 1:18PM(CST) on 7/23/2019) | 448.70 | 445.90 | 447.80 | 0.80 | 447.80 |
| Canola Jan 2020 (updated 1:18PM(CST) on 7/23/2019) | 455.50 | 453.00 | 455.20 | 1.30 | 455.20 |
| Canola Mar 2020 (updated 1:16PM(CST) on 7/23/2019) | 462.40 | 459.90 | 462.00 | 1.10 | 462.00 |
| Canola May 2020 (updated 1:14PM(CST) on 7/23/2019) | 468.20 | 465.70 | 468.20 | 1.50 | 468.20 |
| Canola Jul 2020 (updated 1:14PM(CST) on 7/23/2019) | 473.00 | 470.60 | 473.00 | 1.30 | 473.00 |
| Soybean Aug 2019 | 892.50 | 881.00 | 885.75 | -2.50 | 885.25 |
| Soybean Sep 2019 | 898.00 | 887.00 | 891.50 | -2.50 | 891.00 |
| Soybean Nov 2019 | 910.25 | 898.75 | 903.75 | -2.00 | 903.25 |
| Soybean Jan 2020 | 923.00 | 911.50 | 916.50 | -2.00 | 916.25 |
| Soybean Mar 2020 | 932.50 | 921.50 | 926.25 | -2.00 | 926.25 |
| Soybean May 2020 | 940.50 | 930.00 | 935.25 | -1.75 | 937.00 |
| Soybean Meal Aug 2019 | 309.90 | 306.00 | 306.40 | -2.00 | 306.60 |
| Soybean Meal Sep 2019 | 311.10 | 307.40 | 307.80 | -1.90 | 308.10 |
| Soybean Meal Oct 2019 | 312.70 | 309.00 | 309.40 | -1.90 | 309.70 |
| Soybean Oil Aug 2019 | 28.07 | 27.74 | 28.01 | 0.28 | 27.98 |
| Soybean Oil Sep 2019 | 28.19 | 27.85 | 28.13 | 0.28 | 28.11 |
| Soybean Oil Oct 2019 | 28.30 | 27.98 | 28.23 | 0.28 | 28.24 |
| Corn Sep 2019 | 426.50 | 418.25 | 425.50 | 3.25 | 425.50 |
| Corn Dec 2019 | 432.75 | 424.00 | 431.50 | 4.75 | 431.75 |
| Corn Mar 2020 | 441.25 | 433.00 | 440.50 | 4.75 | 440.50 |
| Corn May 2020 | 445.25 | 437.25 | 444.25 | 4.00 | 444.25 |
| Corn Jul 2020 | 448.25 | 441.00 | 447.25 | 3.50 | 447.25 |
| Oats Sep 2019 | 269.25 | 264.75 | 266.00 | -0.75 | 266.00 |
| Oats Dec 2019 | 269.00 | 265.00 | 266.25 | -0.75 | 266.00 |
| Oats Mar 2020 | 273.25 | 270.00 | 270.50 | -0.25 | 270.00 |
| Oats May 2020 | 269.50 | 269.50 | 269.50 | -0.25 | 269.75 |
| Oats Jul 2020 | 268.75 | 268.75 | 268.75 | -0.25 | 269.00 |
| Wheat Sep 2019 | 493.50 | 483.25 | 487.25 | unch | 487.50 |
| Wheat Dec 2019 | 505.00 | 495.00 | 498.25 | -0.75 | 498.25 |
| Wheat Mar 2020 | 517.25 | 507.75 | 510.75 | -0.75 | 510.75 |
| Wheat May 2020 | 523.25 | 514.25 | 517.25 | -0.75 | 517.25 |
| Wheat Jul 2020 | 525.50 | 517.00 | 519.75 | -0.75 | 519.50 |
| Spring Wheat Sep 2019 | 527.25 | 520.25 | 520.50 | -0.75 | 520.50 |
| Spring Wheat Dec 2019 | 541.00 | 534.75 | 535.00 | unch | 535.00 |
| Spring Wheat Mar 2020 | 555.25 | 550.00 | 550.00 | unch | 550.00 |
| Spring Wheat May 2020 | 561.75 | 559.25 | 559.25 | -0.50 | 559.25 |
| Spring Wheat Jul 2020 | 570.00 | 568.50 | 568.50 | -0.25 | 568.50 |
| Hard Red Wheat Sep 2019 | 435.50 | 426.50 | 431.50 | 2.25 | 431.75 |
| Hard Red Wheat Dec 2019 | 453.75 | 445.50 | 449.25 | 0.75 | 449.50 |
| Hard Red Wheat Mar 2020 | 472.00 | 464.25 | 467.25 | -0.50 | 467.50 |
| Hard Red Wheat May 2020 | 484.00 | 477.00 | 479.00 | -1.00 | 479.25 |
| Hard Red Wheat Jul 2020 | 489.25 | 483.00 | 484.75 | -1.00 | 485.00 |
| Live Cattle (Pit) Aug 2019 | 109.05 | 109.05 | 109.05 | 0.60 | 109.05 |
| Live Cattle (Pit) Oct 2019 | 109.88 | 109.88 | 109.88 | 0.72 | 109.88 |
| Live Cattle (Pit) Dec 2019 | 114.25 | 114.25 | 114.25 | 0.45 | 114.25 |
| Feeder Cattle (Pit) Aug 2019 | 142.20 | 142.20 | 142.20 | 0.02 | 142.20 |
| Feeder Cattle (Pit) Sep 2019 | 142.45 | 142.45 | 142.45 | 0.02 | 142.45 |
| Feeder Cattle (Pit) Oct 2019 | 142.68 | 142.68 | 142.68 | 0.03 | 142.68 |
| Lean Hogs (Pit) Aug 2019 | 86.18 | 86.18 | 86.18 | 2.95 | 86.18 |
| Lean Hogs (Pit) Oct 2019 | 81.80 | 81.80 | 81.80 | 2.60 | 81.80 |
| Lean Hogs (Pit) Dec 2019 | 79.68 | 79.68 | 79.68 | 2.65 | 79.68 |
| Canadian Dollar Aug 2019 | 0.7615 | 0.7602 | 0.7614 | -0.0017 | 0.7614 |
| Crude Oil WTI Sep 2019 | 56.93 | 55.74 | 56.65 | 0.43 | 56.65 |
Prices updated at 1:20PM(CST) on 7/23/2019


