The USDA acreage report dominated crop markets Thursday with soybean rising after the worst fears of a huge soy acreage increase were not realized.
But American farmers seeded many more corn acres than expected and that drove corn futures lower.
Spring wheat and durum acres topped expectations but all three U.S. wheat markets closed the day a little higher.
It was a day that left many scratching their heads:
- Why would American farmers plant so much corn when the spring rally clearly signaled better profits in seeding soybeans?
- Why would soybeans rally when the acreage number came in as expected, the quarterly stocks number was bearish and rain is expected this weekend in the driest region of the Midwest?
- Why would wheat rally when the acreage and stocks number in the USDA reports were bearish?
Read Also

U.S. grains: Soy drops on demand worries, corn firm as traders question lofty yield projections
U.S. soybean futures fell to a 1-1/2 week low on Tuesday as China continued to shun purchases from the United States and as forecasts for improved rains in the coming days reinforced expectations for a sizeable Midwest harvest.
Still, Canadian farmers were happy that canola rallied for a fourth consecutive day with the November contract closing in on $500 a tonne again.
November closed at $495.70 per tonne, up $7.30 while old crop July was up $7 at $485.50.
Compared to the close last Friday, November canola rallied $18.80 a tonne or almost four percent and July rallied $21.30.
ICE Futures Canada will be closed Friday for Canada Day but U.S. markets will be open. The U.S. trade will close Monday.
On Friday the Canadian Oilseed Processors Association said the weekly Canadian canola crush was a strong 182,615 tonnes, up almost 19 percent from the week before and 88.4 percent of capacity.
Saskatchewan’s weekly crop report today said most crops are in good to excellent condition.
Weather conditions are ripe for thunderstorms in Alberta today. Localized rains could continue into Friday in Alberta and Saskatchewan and there could be a larger accumulation Saturday night or Sunday in eastern parts of Saskatchewan.
Turning to the fallout from the USDA report, soybean futures rose while corn fell.
In the case of soybeans, the trade breathed a sigh of relief that area came in at 83.688 million acres. Although the average of pre report estimates was 83.896, the range was 82.1-85.7 million.
“The bean number came pretty close to the average trade guess, but people out there had a ‘fear number’ that was 2.5 to 3 million acres higher than the average trade guess,” said Jim Gerlach, president of A/C Trading. “When that fear wasn’t realized, they considered it bullish.”
Soybeans rallied with July up 2.66 percent and new crop November up 3.66 percent.
Gains were held in check by the quarterly soybean stocks number that, at 870 million bushels, was above a range of trade estimates.
July corn fell 3.8 percent today and new crop December fell 3.1 percent on the USDA’s estimate of 94.1 million acres, above even the highest in a range of pre-report estimates by analysts, and up seven percent from 2015.
Leading up to the report, the trade had expected the strong rally in soybean prices this spring would cause farmers to shift acres from corn into soybeans.
However, farmers decided to stick with their rotations and their most familiar crop. Also, many producers had already applied fertilizer in preparation for planting corn before the soybean price started to rally.
Also it was a better spring for planting and so farmers did not face a situation where it was too wet to seed.
The total acreage seeded to all major crops was 323.43 million acres, up about five million acres from 318.51 million last year
The USDA reported U.S. corn stocks as of June 1 at 4.722 billion bushels, topping a range of pre-report estimates and implying weaker-than-expected usage during the quarter.
A large part of the Midwest, mostly in southern and western regions has had less than 50 percent of normal rainfall in the last 30 days.
A major rain system is expected this weekend focused on Missouri, southern Illinois and Kansas. It appears the rain will miss most of Iowa and the northern half of Illinois, the biggest corn and soy producing states.
Beginning about July 6 temperatures in Iowa are forecast to rise to the low 30s C and that could start to stress corn that does not get rain this weekend, or rain during the heatwave.
I think one way to look at today’s market action is that the trade
- saw that American farmers did not go crazy planting soybeans,
- the demand outlook for 2016-17 is positive,
- there is still a lot of weather between now and harvest.
So traders bid back in a weather premium to account for the possibility for hotter than normal weather in the U.S. Midwest in July and perhaps a drier trend in the region in August when soybeans set their yield.
Wheat initially fell following the USDA reports because the numbers for wheat were bearish, but the market closed up on short covering, stronger than expected weekly wheat export sales and maybe concern about the weekend rain that will delay harvesting in Kansas. Protein in the winter wheat crop is lower than in recent years.
The USDA pegged spring wheat acreage at 12.133 million acres, topping expectations for 11.714 million but down from last year’s 13.247 million.
Durum acreage is 2.145 million, topping expectations for 1.975 million and last year’s 1.936 million.
U.S. wheat stocks as of June 1 were 981 million bushels, in line with trade expectations.
American oats acres will be similar to last year at 3.027 million compared to 3.088 million in 2015.
MINOR CROPS
But several minor crops are expected to lose acreage.
Barley area is expected to decline to 2.967 million acres, from 3.558 million last year.
Oil sunflower area is pegged at 1.429 million, down from 1.551 million last year.
Non-oil sunflowers are at 216,400 acres, down from 308,600 last year.
Canola area is pegged at 1.705 million acres, down from 1.777 million last year.
Flax seed is pegged at 342,000 acres, down from 463,000 last year.
Dry beans are at 1.689 million acres, down from 1.764 million last year.
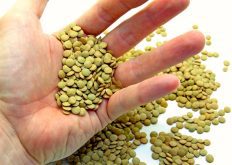
However, like in Canada lentils are up, climbing to 930,000 acres from 493,000 last year
Peas are up at 1.268 million acres, from 1.143 million last year.
Chickpeas are up at 281,300 acres, from 207,500 last year.
Mustard is up at 60,500 acres, from 44,000 last year.
OUTSIDE MARKETS
Light crude oil nearby futures in New York were down $1.55 to US$48.33 per barrel.
The Canadian dollar at noon was US76.87 cents, down from 76.98 cents the previous trading day. The U.S. dollar at noon was C$1.3009.
The Toronto market rode a rally in gold stocks higher.
The Toronto Stock Exchange’s S&P/TSX composite index closed up 27.80 points, or 0.20 percent, at 14,064.54.
The Dow Jones industrial average rose 235.31 points, or 1.33 percent, to 17,929.99, the S&P 500 gained 28.09 points, or 1.36 percent, to 2,098.86 and the Nasdaq Composite added 63.43 points, or 1.33 percent, to 4,842.67.
Winnipeg ICE Futures Canada dollars per tonne
Canola Jul 2016 485.50 +7.00 +1.46%
Canola Nov 2016 495.70 +7.30 +1.49%
Canola Jan 2017 503.20 +9.20 +1.86%
Canola Mar 2017 508.90 +9.40 +1.88%
Canola May 2017 512.90 +9.20 +1.83%
Milling Wheat Oct 2016 217.00 unch 0.00%
Milling Wheat Dec 2016 221.00 +1.00 +0.45%
Durum Wheat Oct 2016 286.00 +5.00 +1.78%
Durum Wheat Dec 2016 288.00 +5.00 +1.77%
Barley Oct 2016 171.50 unch 0.00%
Barley Dec 2016 171.50 unch 0.00%
Soybeans Jul 2016 1175.00 +30.50 +2.66%
Soybeans Aug 2016 1174.25 +33.75 +2.96%
Soybeans Sep 2016 1162.25 +39.25 +3.50%
Soybeans Nov 2016 1153.25 +40.75 +3.66%
Soybeans Jan 2017 1148.25 +39.75 +3.59%
Soybeans Mar 2017 1104.75 +31.25 +2.91%
Soybean Meal Jul 2016 405.30 +8.20 +2.06%
Soybean Meal Aug 2016 405.80 +9.40 +2.37%
Soybean Meal Sep 2016 403.70 +10.00 +2.54%
Soybean Oil Jul 2016 31.38 +0.56 +1.82%
Soybean Oil Aug 2016 31.53 +0.55 +1.78%
Soybean Oil Sep 2016 31.66 +0.55 +1.77%
Corn Jul 2016 358.75 -14.00 -3.76%
Corn Sep 2016 365.50 -12.25 -3.24%
Corn Dec 2016 371.25 -11.75 -3.07%
Corn Mar 2017 379.50 -10.75 -2.75%
Corn May 2017 384.50 -9.75 -2.47%
Oats Jul 2016 205.25 +1.50 +0.74%
Oats Sep 2016 202.50 +0.75 +0.37%
Oats Dec 2016 201.75 +0.50 +0.25%
Oats Mar 2017 213.25 unch 0.00%
Oats May 2017 217.75 unch 0.00%
Wheat Jul 2016 431.25 +1.75 +0.41%
Wheat Sep 2016 445.50 +1.00 +0.22%
Wheat Dec 2016 465.50 +0.25 +0.05%
Wheat Mar 2017 483.25 -1.00 -0.21%
Wheat May 2017 493.75 -1.00 -0.20%
Minneapolis
Spring Wheat Jul 2016 495.25 +2.50 +0.51%
Spring Wheat Sep 2016 508.25 +2.25 +0.44%
Spring Wheat Dec 2016 523.75 +1.25 +0.24%
Spring Wheat Mar 2017 538.25 +1.25 +0.23%
Spring Wheat May 2017 547.50 +1.50 +0.27%
Kansas City
Hard Red Wheat Jul 2016 404.25 +4.25 +1.06%
Hard Red Wheat Sep 2016 422.50 +2.75 +0.66%
Hard Red Wheat Dec 2016 447.75 +2.25 +0.51%
Hard Red Wheat Mar 2017 464.25 +2.25 +0.49%
Hard Red Wheat May 2017 475.00 +2.00 +0.42%
Chicago livestock futures in US¢/pound
Live Cattle (P) Jun 2016 120.00 +1.10 +0.93%
Live Cattle (P) Aug 2016 114.82 +0.69 +0.60%
Live Cattle (P) Oct 2016 114.65 +0.70 +0.61%
Feeder Cattle (P) Aug 2016 144.30 +1.25 +0.87%
Feeder Cattle (P) Sep 2016 143.50 +1.45 +1.02%
Feeder Cattle (P) Oct 2016 141.98 +1.53 +1.09%
Lean Hogs (P) Jul 2016 82.85 -0.25 -0.30%
Lean Hogs (P) Aug 2016 83.28 -0.05 -0.06%
Lean Hogs (P) Oct 2016 71.70 +0.05 +0.07%