Dry weather and a forecast for temperatures in the 30s C this weekend in Saskatchewan and Alberta drove canola futures higher on Wednesday even as soybeans fell.
July canola in Winnipeg closed at $511.90 a tonne, up $5.60 and November closed at $518.30, up $5.20.
A weaker loonie helped support canola.
The forecast calls for the +30 C temperatures to continue into the first half of next week. No serious rain is expected in the next five days.
The next level of resistance will likely be in the $530 to $540 region.
Chicago Board of Trade wheat futures fell on Wednesday after a seesaw session, pulled down by profit-taking from a two-week peak and as the hard red winter wheat harvest expanded in the U.S. southern Plains, traders said.
Corn and soybeans also declined, reversing midsession gains as producers sold old-crop supplies. But uncertainty about the impact of excessive rains in parts of the Midwest underpinned values.
At the CBOT, July wheat settled down 3 ½ cents at $5.18 per bushel. July corn ended off one cent at $3.66 ½ a bushel and July soybeans fell 5 ¾ cents at $9.81 ¾ a bushel.
Wheat retreated after the CBOT July contract reached $5.30, its highest since June 10, but fell short of its 200-day moving average at $5.33.
Dry weather in the southern Plains this week should promote the harvest of hard red winter wheat, the largest U.S. wheat class that is used in bread. But wet conditions in the southern Midwest are stalling the harvest of soft red winter wheat used for cookies and snack foods.
Storms were crossing parts of Iowa and central Illinois on Wednesday, and more precipitation was on the way.
“Tomorrow is the wetter day … when the rains will increase across the central Midwest, (producing) generally 1.5 inches or so,” said Don Keeney, a meteorologist at MDA Weather Services. “It is not good news for the bean planting and wheat harvest.”
Including rain forecasts for the rest of the month, much of eastern Missouri, Illinois, Indiana and western Ohio will receive double their normal rainfall for June, MDA Weather Services said in a note to clients.
The rains helped lift corn and soybean prices for part of the session as traders considered whether U.S. yield prospects were being reduced.
Read Also

U.S. livestock: Hog futures hit contract highs on shock herd decline
Chicago | Reuters – Lean hog futures stormed to contract highs at the Chicago Mercantile Exchange on Friday as smaller-than-expected…
“Farmer selling continues to cap the rallies, not only in the United States but in South America,” said Don Roose, president of U.S. Commodities in West Des Moines, Iowa.
Traders continued to adjust positions ahead of two key U.S. government crop reports on U.S. acreage and quarterly stocks due June 30.
Light crude oil nearby futures in New York were down 74 cents to US$60.27 per barrel.
The Canadian dollar at noon was US80.55 cents, down from 81.12 cents the previous trading day. The U.S. dollar at noon was C$1.2415.
The Toronto Stock Exchange’s S&P/TSX composite index closed up 42.60 points, or 0.29 percent, at 14,947.51, for its third straight gain.
The Dow Jones industrial average fell 178 points, or 0.98 percent, to 17,966.07, the S&P 500 lost 15.62 points, or 0.74 percent, to 2,108.58 and the Nasdaq Composite dropped 37.68 points, or 0.73 percent, to 5,122.41.
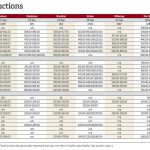
Winnipeg ICE Futures Canada dollars per tonne
Canola Jul 2015 511.90 +5.60 +1.11%
Canola Nov 2015 518.30 +5.20 +1.01%
Canola Jan 2016 514.40 +4.60 +0.90%
Canola Mar 2016 510.90 +4.50 +0.89%
Canola May 2016 507.20 +4.70 +0.94%
Milling Wheat Jul 2015 217.00 -2.00 -0.91%
Milling Wheat Oct 2015 222.00 -2.00 -0.89%
Milling Wheat Dec 2015 222.00 -2.00 -0.89%
Durum Wheat Jul 2015 298.00 unch 0.00%
Durum Wheat Oct 2015 298.00 unch 0.00%
Durum Wheat Dec 2015 303.00 unch 0.00%
Barley Jul 2015 203.00 +2.00 +1.00%
Barley Oct 2015 198.00 +2.00 +1.02%
Barley Dec 2015 203.00 +2.00 +1.00%
American crop prices in cents US/bushel, soybean meal in $US/short ton, soy oil in cents US/pound
Chicago
Soybeans Jul 2015 981.75 -5.75 -0.58%
Soybeans Aug 2015 967.25 -5.5 -0.57%
Soybeans Sep 2015 957 -4.25 -0.44%
Soybeans Nov 2015 956 -4.75 -0.49%
Soybeans Jan 2016 961.75 -4.25 -0.44%
Soybeans Mar 2016 963 -3 -0.31%
Soybean Meal Jul 2015 328 -3.9 -1.18%
Soybean Meal Aug 2015 322.5 -4.8 -1.47%
Soybean Meal Sep 2015 317.6 -4.2 -1.31%
Soybean Oil Jul 2015 33.27 +0.45 +1.37%
Soybean Oil Aug 2015 33.35 +0.45 +1.37%
Soybean Oil Sep 2015 33.42 +0.46 +1.40%
Corn Jul 2015 366.5 -1 -0.27%
Corn Sep 2015 371.5 -0.5 -0.13%
Corn Dec 2015 380.5 -0.75 -0.20%
Corn Mar 2016 391.5 -1 -0.25%
Corn May 2016 398.5 -1 -0.25%
Oats Jul 2015 256.5 +2.25 +0.88%
Oats Sep 2015 262.75 +1.25 +0.48%
Oats Dec 2015 269 +1.5 +0.56%
Oats Mar 2016 273.75 +0.75 +0.27%
Oats May 2016 278.5 +0.5 +0.18%
Wheat Jul 2015 518 -3.5 -0.67%
Wheat Sep 2015 523.25 -3.75 -0.71%
Wheat Dec 2015 535 -4 -0.74%
Wheat Mar 2016 547 -4 -0.73%
Wheat May 2016 555 -3.75 -0.67%
Minneapolis
Spring Wheat Jul 2015 563.75 -6 -1.05%
Spring Wheat Sep 2015 575.75 -5.25 -0.90%
Spring Wheat Dec 2015 590.25 -4 -0.67%
Spring Wheat Mar 2016 603 -3.75 -0.62%
Spring Wheat May 2016 611 -3.5 -0.57%
Kansas City
Hard Red Wheat Jul 2015 524.5 -5.75 -1.08%
Hard Red Wheat Sep 2015 533 -6.75 -1.25%
Hard Red Wheat Dec 2015 552.25 -7 -1.25%
Hard Red Wheat Mar 2016 566 -7.25 -1.26%
Hard Red Wheat May 2016 575 -7 -1.20%


