After two days of gains, canola and soybeans edged lower on Thursday, weighed down by technical selling and generally good growing conditions.
Oilseeds were also pressured by a weekly USDA export sales report that showed U.S. soybean sales were less than expected. Wheat and corn sales were within the range of analysts’ expectations.
November canola dropped $2.70 at $451.20 per tonne.
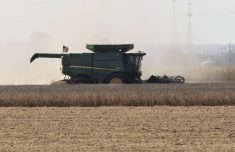
CROP CONDITIONS
Today’s Saskatchewan crop report said the province’s crops were generally in great shape.
For canola 36 percent was excellent and 59 percent was good.
Read Also
Grain trader Bunge lowers 2025 profit forecast after closing Viterra deal
U.S. grain trader and processor Bunge on Wednesday lowered its 2025 earnings forecast following its merger with Viterra, and said it is overhauling segment and volume reporting to align with its integrated operations.
Pulse crops were suffering a little more than others.
The report said lentils were 17 percent excellent, 49 percent good, 21 percent fair, eight percent poor and five percent very poor. The western part of the lentil-growing region in the south has hurting more than the eastern half, the report said.
In peas, 35 percent were excellent, 55 percent were good, seven percent were fair, two percent poor and one percent very poor.
WEATHER
There are the usual chances for thunderstorms through the weekend.
The U.S. weather service long range maps point to the potential for a wetter regional trend in southern Manitoba in the first half of next week.
Watch our weekly video crop market update
Accumulations Monday in the southwest corner of the province could amount to an inch or more and then an additional rain through much of the southern half of the province in the next day or two. Overall, much of the southern part of Manitoba could accumulate an inch of rain, with points in the southwest accumulating closer to two inches.
WHEAT
Wheat futures fell Thursday on ample world supplies.
After the market closed there was slightly bullish news for spring wheat from the U.S. Wheat Quality Council’s spring wheat tour. However the news for durum prices was bearish.
Yield potential for U.S. spring wheat is down this year compared to last year’s record-large crop, and slightly below the average of recent years, according to results from the annual crop tour.
The 2016 U.S. hard red spring wheat crop was projected to yield 45.7 bushels per acre, down from the tour’s 2015 forecast of 49.9 bu. and the tour’s prior five-year average of 45.96 bu.
Scouts on the three-day tour of North Dakota and adjacent areas in Minnesota and South Dakota also projected an average yield for 2016 durum wheat of 45.4 bu. per acre, up from 39.2 last year. The five-year average for durum is 38.3 bushels per acre.
Corn futures dipped about one percent today on ideas that the USDA might increase its forecast for U.S. corn yield in its monthly report due Aug. 12.
INTERNATIONAL GRAINS COUNCIL
The International Grains Council raised its forecasts for global corn production in 2016-17 to 1.017 billion tonnes, up from a previous projection of 1.003 billion and the prior season’s 968 million.
The IGC also raised its forecast for global wheat production to 735 million tonnes, up from a previous projection of 729 million but still marginally below 2015’s 736 million.
“Much of the upward (wheat) revision is for the CIS (former Soviet Union) and the U.S., but the figure is reduced for the EU, where there is increasing evidence of yield and quality damage following untimely rains,” the IGC said.
Crude oil fell about two percent today and was on its way to the biggest monthly loss in a year as the world produces more oil than it needs.
It has fallen about 20 percent since hitting a 2016 high of US$51.67 on June 9.
Stocks of gasoline are rising in the U.S. as refiners overestimated summer driving demand.
Light crude oil nearby futures in New York closed down 78 cents to US$41.14 per barrel.
The Canadian dollar at noon was US75.93 cents, up from 75.64 cents the previous trading day. The U.S. dollar at noon was C$1.3170.
The Toronto Stock Exchange’s S&P/TSX composite index ended up 6.18 points, or 0.04 percent, at 14,552.72.
The Dow Jones industrial average edged down 0.09 percent to end at 18,456.35 points and the S&P 500 gained 0.16 percent to 2,170.06. The Nasdaq Composite added 0.3 percent to 5,154.98.
Winnipeg ICE Futures Canada dollars per tonne
Canola Nov 2016 451.20 -2.70 -0.59%
Canola Jan 2017 458.30 -2.90 -0.63%
Canola Mar 2017 465.00 -2.30 -0.49%
Canola May 2017 469.90 -1.60 -0.34%
Canola Jul 2017 474.30 -1.10 -0.23%
Milling Wheat Oct 2016 207.00 unch 0.00%
Milling Wheat Dec 2016 211.00 unch 0.00%
Durum Wheat Oct 2016 260.00 unch 0.00%
Durum Wheat Dec 2016 263.00 unch 0.00%
Barley Oct 2016 145.00 -5.00 -3.33%
Barley Dec 2016 145.00 -5.00 -3.33%
American crop prices in cents US/bushel, soybean meal in $US/short ton, soy oil in cents US/pound
Chicago
Soybeans Aug 2016 1003.50 -7.00 -0.69%
Soybeans Sep 2016 993.25 -6.50 -0.65%
Soybeans Nov 2016 978.00 -8.00 -0.81%
Soybeans Jan 2017 978.50 -7.75 -0.79%
Soybeans Mar 2017 968.00 -7.00 -0.72%
Soybeans May 2017 963.00 -7.25 -0.75%
Soybean Meal Aug 2016 341.50 -3.30 -0.96%
Soybean Meal Sep 2016 342.80 -3.00 -0.87%
Soybean Meal Oct 2016 341.90 -2.50 -0.73%
Soybean Oil Aug 2016 29.49 -0.04 -0.14%
Soybean Oil Sep 2016 29.64 -0.02 -0.07%
Soybean Oil Oct 2016 29.75 -0.02 -0.07%
Corn Sep 2016 331.25 -4.50 -1.34%
Corn Dec 2016 338.75 -4.25 -1.24%
Corn Mar 2017 347.50 -4.25 -1.21%
Corn May 2017 353.25 -3.75 -1.05%
Corn Jul 2017 358.50 -3.50 -0.97%
Oats Sep 2016 198.25 +1.25 +0.63%
Oats Dec 2016 197.25 +0.50 +0.25%
Oats Mar 2017 201.75 +0.25 +0.12%
Oats May 2017 202.00 -2.50 -1.22%
Oats Jul 2017 207.75 -2.50 -1.19%
Wheat Sep 2016 410.25 -4.50 -1.08%
Wheat Dec 2016 437.25 -4.25 -0.96%
Wheat Mar 2017 462.00 -5.25 -1.12%
Wheat May 2017 475.25 -5.50 -1.14%
Wheat Jul 2017 482.25 -5.50 -1.13%
Minneapolis
Spring Wheat Sep 2016 486.75 -1.50 -0.31%
Spring Wheat Dec 2016 501.75 -2.00 -0.40%
Spring Wheat Mar 2017 517.25 -1.75 -0.34%
Spring Wheat May 2017 527.00 -1.75 -0.33%
Spring Wheat Jul 2017 536.75 -2.00 -0.37%
Kansas City
Hard Red Wheat Sep 2016 409.00 -3.50 -0.85%
Hard Red Wheat Dec 2016 435.00 -3.50 -0.80%
Hard Red Wheat Mar 2017 452.00 -3.50 -0.77%
Hard Red Wheat May 2017 463.00 -3.25 -0.70%
Hard Red Wheat Jul 2017 472.25 -4.00 -0.84%
Chicago livestock futures in US¢/pound (rounded to two decimals)
Live Cattle (P) Aug 2016 113.32 -0.63 -0.55%
Live Cattle (P) Oct 2016 112.10 -0.95 -0.84%
Live Cattle (P) Dec 2016 112.68 -1.22 -1.07%
Feeder Cattle (P) Aug 2016 140.48 -1.80 -1.27%
Feeder Cattle (P) Sep 2016 139.15 -1.97 -1.40%
Feeder Cattle (P) Oct 2016 138.35 -1.90 -1.35%
Lean Hogs (P) Aug 2016 68.85 -2.83 -3.95%
Lean Hogs (P) Oct 2016 59.20 -1.85 -3.03%
Lean Hogs (P) Dec 2016 54.82 -1.63 -2.89%