An improvement in the U.S. soybean crop condition rating pressured soybeans lower Tuesday and that pulled canola lower.
It was generally a down day on crop markets as the slightly lower crop condition ratings for U.S. corn and spring wheat were offset by the generally favourable weather forecast for the Midwest.
November canola dipped below the $500 leve, closing at $498.40, down $10.20 a tonne.
Canola was down two percent while November soybeans were down 3.5 percent.
The U.S. Department of Agriculture late Monday rated 59 percent of the U.S. soy crop in good to excellent condition, up from 57 percent a week earlier.
Read Also
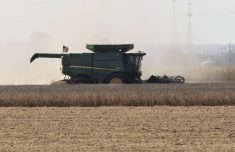
Alberta harvest wrapping up: report
Harvest operations advanced to 96 per cent complete in Alberta as of Oct. 7, with only a few late-seeded cereal and canola fields remaining, according to the latest provincial crop report.
Also, long range temperature forecasts show that cooler than normal weather in the U.S. Midwest means there should be little heat stress this month as soybeans go into their reproductive stage.
All three classes of wheat fell even though the spring wheat good to excellent fell to 31 percent from 33.
Wheat is feeling downward pressure from the advancing U.S. winter harvest.
USDA ON AUG. 10
The market could continue on this negative trend, barring surprise changes in the weather forecast.
The USDA monthly supply and demand report due Aug. 10 is expected to trim corn and spring wheat yield forecasts but it has the potential to shake things up if the cuts are larger than expected.
OUTSIDE MARKETS
Light crude oil nearby futures in New York were down $1.01 US$49.16 per barrel.
The Canadian dollar was trading in the afternoon around US79.72 cents down .42 cents. The U.S. dollar was $1.2544.
The S&P/TSX Composite Index gained 58.23 points or 0.38 percent to close at 15,202.10.
The Dow Jones Industrial Average rose 72.80 points, or 0.33 percent, to close at 21,963.92, the S&P 500 gained 6.05 points, or 0.24 percent, to 2,476.35 and the Nasdaq Composite added 14.82 points, or 0.23 percent, to 6,362.94.
Winnipeg ICE Futures Canada dollars per tonne
Canola Nov 17 498.40s -10.20 -2.01%
Canola Jan 18 503.90s -9.80 -1.91%
Canola Mar 18 507.80s -9.90 -1.91%
Canola May 18 510.30s -9.50 -1.83%
Canola Jul 18 512.90s -8.80 -1.69%
Milling Wheat Oct 17 274.00s -5.00 -1.79%
Milling Wheat Dec 17 277.00s -5.00 -1.77%
Milling Wheat Mar 18 282.00s -4.00 -1.40%
Durum Wheat Oct 17 308.00s unch unch
Durum Wheat Dec 17 309.00s unch unch
Durum Wheat Mar 18 291.00s unch unch
Barley Oct 17 145.00s +5.00 +3.57%
Barley Dec 17 141.00s +1.00 +0.71%
Barley Mar 18 141.00s +1.00 +0.71%
American crop prices in cents US/bushel, soybean meal in $US/short ton, soy oil in cents US/pound. Prices are displayed with fractions (2/8, 4/8, and 6/8) instead of decimals. -2 equals .25, -4 equals .50, -6 equals .75. The “s” means it is the settlement.
Chicago
Soybeans Aug 17 959-4s -35-0 -3.52%
Soybeans Sep 17 964-2s -35-2 -3.53%
Soybeans Nov 17 971-6s -35-4 -3.52%
Soybeans Jan 18 980-6s -35-2 -3.47%
Soybeans Mar 18 987-0s -33-4 -3.28%
Soybean Meal Aug 17 308.3s -10.3 -3.23%
Soybean Meal Sep 17 310.3s -10.4 -3.24%
Soybean Meal Oct 17 312.0s -10.6 -3.29%
Soybean Oil Aug 17 33.86s -0.85 -2.45%
Soybean Oil Sep 17 33.97s -0.84 -2.41%
Soybean Oil Oct 17 34.08s -0.84 -2.41%
Corn Sep 17 362-4s -8-2 -2.23%
Corn Dec 17 376-4s -8-2 -2.14%
Corn Mar 18 388-4s -7-6 -1.96%
Corn May 18 394-0s -7-6 -1.93%
Corn Jul 18 399-2s -7-6 -1.90%
Oats Sep 17 280-2s -4-0 -1.41%
Oats Dec 17 281-4s -4-6 -1.66%
Oats Mar 18 282-2s -3-2 -1.14%
Oats May 18 281-4s -3-0 -1.05%
Oats Jul 18 280-2s -3-0 -1.06%
Wheat Sep 17 461-2s -13-2 -2.79%
Wheat Dec 17 487-6s -12-0 -2.40%
Wheat Mar 18 509-4s -11-2 -2.16%
Wheat May 18 522-4s -10-2 -1.92%
Wheat Jul 18 531-0s -9-4 -1.76%
Minneapolis
Spring Wheat Sep 17 718-0s -13-2 -1.81%
Spring Wheat Dec 17 730-6s -13-4 -1.81%
Spring Wheat Mar 18 729-6s -12-2 -1.65%
Spring Wheat May 18 720-4s -12-0 -1.64%
Spring Wheat Jul 18 707-6s -12-4 -1.74%
Kansas City
Hard Red Wheat Sep 17 465-2s -9-4 -2.00%
Hard Red Wheat Dec 17 492-6s -9-2 -1.84%
Hard Red Wheat Mar 18 510-4s -9-2 -1.78%
Hard Red Wheat May 18 524-0s -8-6 -1.64%
Hard Red Wheat Jul 18 538-2s -8-2 -1.51%
Chicago livestock futures in US¢/pound (rounded to two decimal places)
Live Cattle (Pit) Aug 17 112.800s +0.800 +0.71%
Live Cattle (Pit) Oct 17 112.875s +0.925 +0.83%
Live Cattle (Pit) Dec 17 114.200s +1.050 +0.93%
Feeder Cattle (Pit) Aug 17 149.175s +3.000 +2.05%
Feeder Cattle (Pit) Sep 17 149.450s +2.800 +1.91%
Feeder Cattle (Pit) Oct 17 148.850s +2.625 +1.80%
Lean Hogs (Pit) Aug 17 79.800s -0.500 -0.62%
Lean Hogs (Pit) Oct 17 64.400s -1.625 -2.46%
Lean Hogs (Pit) Dec 17 59.400s -1.100 -1.82%