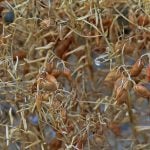
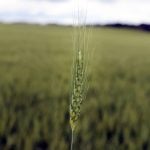
Canola made small gains, in the $1 range, on Friday, without a great deal of activity in the market. November canola closed at $493.60, with all 2019 contracts ending above $500. Chicago soybeans appeared to aid canola along with weather and crop reports that are suggesting that a lack of rain is hurting yields. Soybeans made gains on the day, with American export sales proceeding well, despite the loss of the Chinese market. Prices for August on the CBOT ended up 9 US cents at $8.70-25. Corn was flat, with support coming from the International Grains Council report showing slightly lower projected ending stocks, based on better than planned demand. Spring wheat on American markets continued a lonely rise, as other wheat was off.
Read Also

U.S. grains: Soy futures set six-week low as China buys Argentine cargoes, snubs U.S.
Chicago | Reuters – U.S. soybean futures set a six-week low on Tuesday under pressure from a lack of Chinese…
| Name / Contract | High | Low | Last | Change | Settlement |
| Canola Nov 2018 (updated 1:19PM(CST) on 7/27/2018) | 494.30 | 490.80 | 493.60 | 0.80 | 493.60 |
| Canola Jan 2019 (updated 1:19PM(CST) on 7/27/2018) | 500.70 | 498.40 | 500.10 | 0.90 | 500.10 |
| Canola Mar 2019 (updated 1:19PM(CST) on 7/27/2018) | 505.90 | 503.80 | 505.50 | 0.80 | 505.50 |
| Canola May 2019 (updated 1:18PM(CST) on 7/27/2018) | 510.70 | 508.60 | 510.40 | 0.90 | 510.40 |
| Canola Jul 2019 (updated 1:18PM(CST) on 7/27/2018) | 513.30 | 510.70 | 512.80 | 1.20 | 512.80 |
| Soybeans Aug 2018 | 874.00 | 858.25 | 870.25 | 9.00 | 870.50 |
| Soybeans Sep 2018 | 879.00 | 863.25 | 875.75 | 9.50 | 875.25 |
| Soybeans Nov 2018 | 889.00 | 873.00 | 885.25 | 9.25 | 885.25 |
| Soybeans Jan 2019 | 899.25 | 883.50 | 895.50 | 9.25 | 895.50 |
| Soybeans Mar 2019 | 908.00 | 892.75 | 904.75 | 9.25 | 904.50 |
| Soybeans May 2019 | 917.00 | 902.25 | 914.00 | 9.50 | 913.25 |
| Soybean Meal Aug 2018 | 336.00 | 331.60 | 333.40 | 0.80 | 332.70 |
| Soybean Meal Sep 2018 | 335.30 | 330.70 | 332.60 | 0.50 | 331.80 |
| Soybean Meal Oct 2018 | 334.90 | 330.30 | 332.10 | 0.40 | 331.30 |
| Soybean Oil Aug 2018 | 28.58 | 28.11 | 28.49 | 0.34 | 28.56 |
| Soybean Oil Sep 2018 | 28.70 | 28.22 | 28.61 | 0.34 | 28.67 |
| Soybean Oil Oct 2018 | 28.81 | 28.35 | 28.71 | 0.34 | 28.78 |
| Corn Sep 2018 | 363.75 | 359.50 | 361.50 | unch | 362.00 |
| Corn Dec 2018 | 378.00 | 373.50 | 375.75 | unch | 376.25 |
| Corn Mar 2019 | 388.50 | 384.25 | 386.25 | unch | 386.75 |
| Corn May 2019 | 394.00 | 390.25 | 391.50 | -0.50 | 392.50 |
| Corn Jul 2019 | 399.25 | 395.50 | 397.00 | -0.25 | 397.75 |
| Oats Sep 2018 | 233.50 | 231.50 | 232.25 | -0.25 | 232.00 |
| Oats Dec 2018 | 241.00 | 238.00 | 240.25 | 1.25 | 239.25 |
| Oats Mar 2019 | 243.75 | 243.75 | 243.75 | 0.25 | 243.75 |
| Oats May 2019 | 245.50 | 245.50 | 245.50 | 0.25 | 245.50 |
| Oats Jul 2019 | 249.25 | 249.25 | 249.25 | 0.25 | 249.25 |
| Wheat Sep 2018 | 542.00 | 525.25 | 530.25 | -6.25 | 530.50 |
| Wheat Dec 2018 | 561.25 | 545.00 | 549.50 | -7.00 | 550.00 |
| Wheat Mar 2019 | 576.50 | 560.75 | 565.25 | -6.75 | 566.00 |
| Wheat May 2019 | 581.50 | 567.75 | 571.75 | -6.00 | 572.25 |
| Wheat Jul 2019 | 581.25 | 568.50 | 572.75 | -3.75 | 573.50 |
| Spring Wheat Sep 2018 | 595.00 | 581.00 | 592.50 | 4.75 | 592.50 |
| Spring Wheat Dec 2018 | 609.50 | 595.50 | 606.25 | 4.50 | 606.25 |
| Spring Wheat Mar 2019 | 623.00 | 610.50 | 620.25 | 3.50 | 620.25 |
| Spring Wheat May 2019 | 630.00 | 624.50 | 627.75 | 2.50 | 627.75 |
| Spring Wheat Jul 2019 | 634.00 | 630.50 | 634.50 | 3.25 | 634.50 |
| Hard Red Wheat Sep 2018 | 538.00 | 525.75 | 532.25 | -1.75 | 532.50 |
| Hard Red Wheat Dec 2018 | 564.50 | 552.25 | 559.50 | -1.00 | 559.50 |
| Hard Red Wheat Mar 2019 | 581.75 | 570.25 | 576.50 | -1.25 | 577.00 |
| Hard Red Wheat May 2019 | 587.25 | 578.25 | 584.00 | -1.50 | 584.00 |
| Hard Red Wheat Jul 2019 | 591.00 | 580.25 | 585.25 | -2.25 | 586.50 |
| Live Cattle (P) Aug 2018 | 109.15 | 107.45 | 109.02 | 1.07 | 108.62 |
| Live Cattle (P) Oct 2018 | 110.90 | 108.98 | 110.80 | 1.43 | 110.47 |
| Live Cattle (P) Dec 2018 | 114.53 | 113.22 | 114.50 | 0.85 | 114.15 |
| Feeder Cattle (P) Aug 2018 | 152.68 | 150.80 | 152.50 | 1.07 | 152.30 |
| Feeder Cattle (P) Sep 2018 | 152.50 | 151.08 | 152.40 | 0.58 | 152.18 |
| Feeder Cattle (P) Oct 2018 | 152.95 | 151.83 | 152.95 | 0.07 | 152.75 |
| Lean Hogs (P) Aug 2018 | 64.45 | 63.52 | 63.68 | -1.22 | 63.65 |
| Lean Hogs (P) Oct 2018 | 52.08 | 50.48 | 51.00 | -1.25 | 50.88 |
| Lean Hogs (P) Dec 2018 | 47.38 | 46.12 | 46.65 | -0.80 | 46.45 |
| Canadian Dollar Aug 2018 | 0.7660 | 0.7651 | 0.7654 | unch | 0.7654 |
| Crude Sep 2018 | 69.77 | 68.26 | 68.83 | -0.78 | 68.69 |