
An app that evaluates the risk of aphanomyces in prairie fields has been developed at the University of Saskatchewan.
It recently received funding from Saskatchewan Pulse Growers.
“It’s a working project but we’re quite happy with the way it works and we hope producers use it to lower their risk of aphanomyces root rot,” said Steve Shirtliffe of the university.
“Of course, if you suspect anything at all you should test your soil. This is a prediction tool; it’s not going to give a yes or no answer. We can only evaluate the risk; we can’t evaluate what actually will happen.”
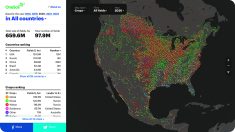
The platform developed by Shirtliffe, Thuan Ha and Aristides Mairena taps into the Google Earth Engine, or GEE, to assess field-specific risks of agronomic issues including aphanomyces.
During a presentation at the College of Agriculture and Bioresources Soils and Crops virtual conference, Shirtliffe said Google created GEE by scraping data from hundreds of sources on the internet.
The cloud-based computing platform contains almost all the publicly available, remotely sensed satellite data for the past 50 years including NDVI imagery.
NDVI is the normalized difference vegetation index, which is a simple graphical indicator that can be used to describe the difference between visible and near-infrared reflectance of vegetation cover, to measure how much crop biomass there is that is actively doing photosynthesis.
GEE is an information repository, as well as an analytical tool.
“It allows you to write programs or to essentially modify code from other programs and allows you to gain free access and analysis to over 50 years of satellite and remote-sensing information,” Shirtliffe said.
“With a few lines of code, you can call up that data and get it to either be displayed or to even do analyzes ranging from very simple analysis, such as making an NDVI vegetative index, to even machine learning.”
Images available in GEE include catalogs from Landsat satellites, which began taking images in 1972 and the mission continues today.
Landsat began providing images every 16 days with 30-metre resolution and with the launch of Landsat 10 the images are now taken every eight days.
The Sentinel satellite constellation has 10-metre resolution and provides images every five days.
There are satellites with much higher resolutions, but their images are accessible only through paid subscriptions.
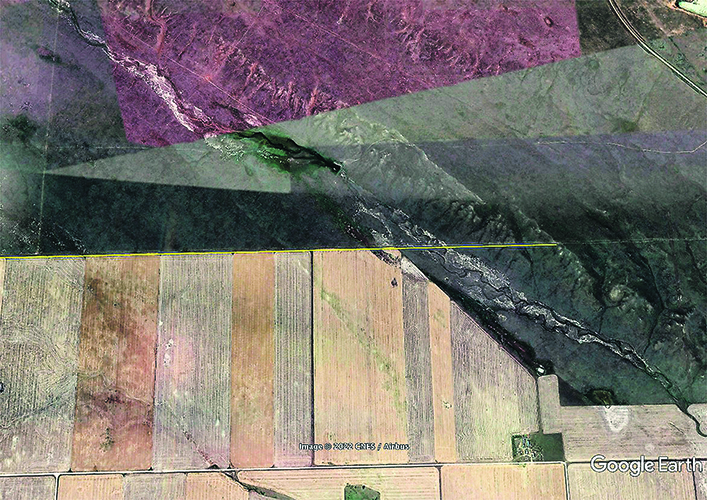
Even with a resolution of 30-by-30 metres, important information can be found from these images.
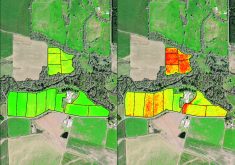
“The average NDVI over a set of years and you can see that there are areas in these fields that are showing higher NDVI on average in areas, and lower, and that may be able to tell us something about those fields,” Shirtliffe said.
Satellite images collect more light bands beyond infrared, including blue, green and near infrared, so many indices can be produced with this data.
“Once they get out into the shortwave infrared this can give us some information about how much water is on the surface or in the vegetation, but that is for another day,” Shirtliffe said.
He said Bruno Basso’s group out of Michigan uses Landsat data to characterize the spatial variability within a field.
“He’s been able to characterize (areas of) fields of having stable high yields, stable low yields, and unstable yields, and this of course can give us some information about precision agriculture,” Shirtliffe said.
Other data in the GEE include climate reanalysis such as precipitation, temperature and humidity over a given day can be estimated for specific areas.
GEE also has access to field elevation and terrain data.
Using the data sets with 30-metre resolution isn’t usable within a field to help with something like drainage, but this is a high enough resolution to measure evapotranspiration.
“They measure directly with satellites and larger pixels where it’s essentially measuring the heat or the temperature and they use a model that calculates essentially if it’s cooler in an area for a given rate of radiation. They know that water is being evaporated and they’ve calibrated this to measure evapotranspiration,” Shirtliffe said.
The Ag Canada annual crop inventory for crops grown in Western Canada since 2009 is accessible through GEE.
This initiative uses RADARSA, a Canadian remote-sensing Earth observation satellite program, and imagery from Landsat and Sentinel two satellites.
“They (Ag Canada) train this data up using some crop insurance data and then classify the fields to predict what crops are grown and they’re about 95 percent accurate,” Shirtliffe said.
He said the ability to look at rotations and environmental conditions that GEE provides gave him an idea related to work he’s done with Syama Chatterton and Sabine Banniza on root rot in pulses.
“We’ve been looking at crop rotation and other factors like cover crops and to be honest we’ve tried really hard, but we haven’t really found anything that works (to prevent aphanomyces),” Shirtliffe said.
“So, the best thing we can do is really try to avoid it using risks. So, we know that these spores are long-lived in the soil and when confirmed a six-to-eight-year crop rotation is recommended.”
Sask Pulse has a fact sheet available on its website to help producers make decisions on whether they should grow a pulse crop that is susceptible to aphanomyces on specific fields.
Shirtliffe said many of the risk factors on the fact sheet can be examined through the data sets on GEE.
For instance, if the environment was wet the last time peas or lentils were grown this increases the risk for aphanomyces.
The maps in GEE can also see symptoms of aphanomyces when peas or lentils were grown, including field patches or whole-field effects.
The number of times peas and lentils were grown in the past 12 years can also be examined.
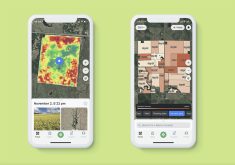
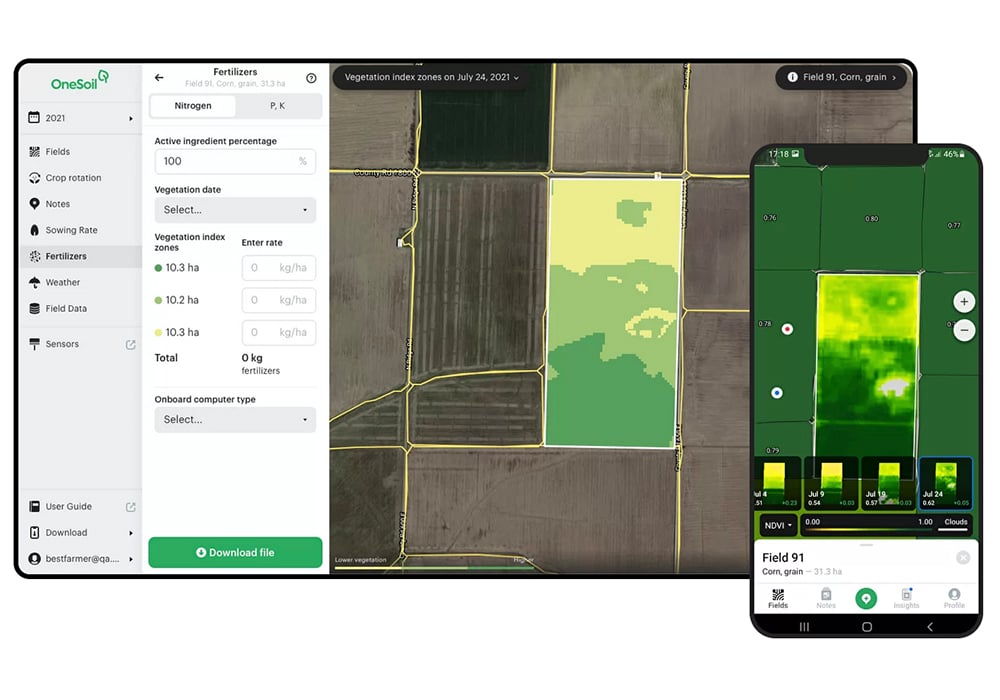
In the aphanomyces-risk evaluation app users can choose a crop in a drop-down menu, including an aphanomyces-susceptible crop (peas and lentils) and then highlight an area.
In the highlighted area, fields are shown with different colours, which indicates their risk to aphanomyces.
A specific field can then be chosen and once the data loads the crop rotation since 2009 is available, as well as the precipitation during key times in the growing season.
“We’re accessing a precipitation layer, this is for the aphanomyces mostly. We determine that the May to June precipitation is probably the most important for that disease,” Shirtliffe said.
He said the app is an early version and that more data layers will be included, such as soil texture data as well as the ability to home-in on areas of the field that had issues.
For instance, lower areas in fields are where aphanomyces tend to start during wet years, so it may be possible to include this pattern of the disease in the risk analysis.
The app will also be useful for agronomic risk assessments beyond aphanomyces, including canola diseases such as clubroot.
“We’re not proposing to replace the crop scout with a bunch of computers,” Shirtliffe said.
“We still need boots on the ground, but what information can we give those boots on ground so they can make the best decision.”