One of the debates about the U.S. Department of Agriculture’s Prospective Plantings report released March 31 was to what extent farmers factored in the recent increase in fertilizer prices.
The survey was conducted at the beginning of the month, which was after the war in the Middle East began at the end of February.
Given that planting is just around the corner in the corn belt, most farmers were likely very aware of higher fertilizer prices and their impact on crop profitability.
Read Also

Farm practices must respond to soaring fertilizer prices
The rising cost of production has changed the conversation on whether the time is right for farms to improve their precision agriculture practices.
Farmers have decided to plant fewer acres to crops this year.
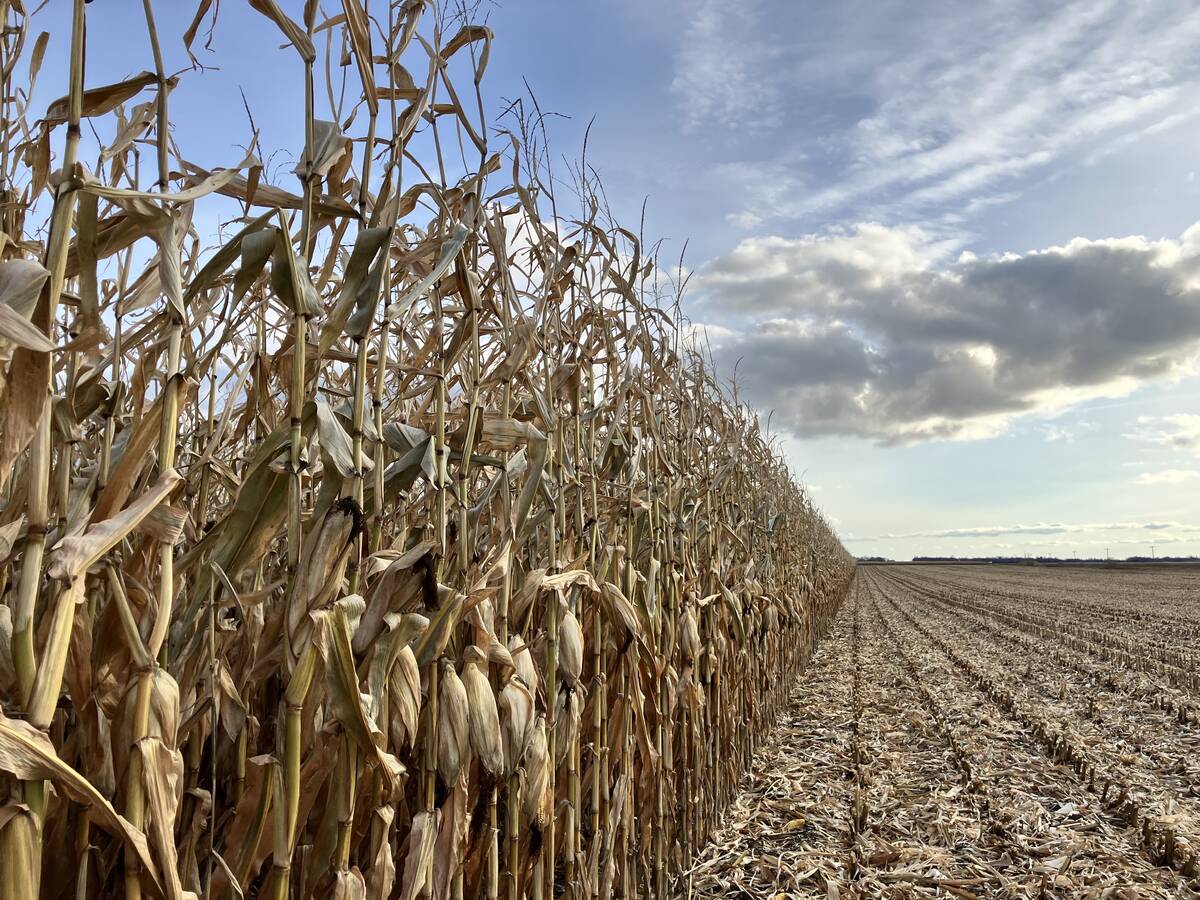
Total area planted in 2026 is forecast to reach 310 million acres, which is down from the 312 million acres planted last year.
This is one of the ways that farmers are coping with the higher input costs this year. They are also devoting a larger area to crops that require less nitrogen fertilizer.
Soybean area is forecast to increase by four per cent to 84.7 million acres. The total area increase was 2.85 million acres, with the bulk of the gains reported in the corn belt and Delta states.
Corn area was obviously replaced in the corn belt, while the Delta (Mississippi) increase came from lower cotton area.
Canola area in the northern Plains increased by 347,000 acres to 2.69 million acres despite high fertilizer costs. This mirrors the increase in canola area expected in Canada.
Corn area dropped by 3.4 million acres (three per cent) from last year to 95.4 million acres. Lower intended corn area came mostly from the corn belt states, but also from reductions in the northern Plains and Delta region.
The U.S. wheat area dropped to the smallest since 1919 at 43.8 million acres.
The area drop was caused by a two per cent reduction in winter wheat area, while spring wheat dropped by six per cent from last year.
The drop in winter wheat was down from the first survey done in December. Winter wheat is expected to fall to 32.4 million acres. Hard red winter wheat area was pegged at 23.1 million acres.
The drop in spring wheat area was expected due to the lower prices and higher input costs.
The largest spring wheat area reduction occurred in Minnesota (down 10 per cent) and North Dakota (down 13 per cent), while Montana’s area remained unchanged from last year. South Dakota reported a drop of only four per cent.
The hard red spring wheat area is currently the lowest since records on the class began in the 1980s.
Durum acres are down by 11 per cent to 1.95 million acres in the report. This area is lower than the past two years, but still above the 2019-23 period.
The drop in durum acreage was not unexpected because prices have dropped by US50 to 75 cents per bushel from last year.
The drop in spring wheat and durum in the United States mirrors the situation in Canada. The Statistics Canada report in early March also pointed to a decline in both wheat and durum area this year.
The one difference between the two countries is that the total wheat area (wheat and durum) in Canada has remained relatively stable over the past 10 years, while the U.S. continues to experience a decline in area.
This trend is expected to continue in the coming years as U.S. wheat area drops while Canadian area remains relatively stable.