CARMAN, Man. – One of the key factors in creating profit is the ability to decide when to keep on investing in a crop and when it’s time to let it go.
Accurately determining these thresholds is important for insecticides, herbicides, top dressing nutrients and especially with fungicides, which cost $15 to $20 per acre.
“At what point do you stop pouring money into a crop,” asked Rob Park, an instructor at this year’s Crop Diagnostic School in Carman, Man.
“Making this decision, and making sure it’s the right decision, is often the difference between profit and loss,” said the Manitoba Agriculture agrologist.
Read Also

VIDEO: Green Lightning and Nytro Ag win sustainability innovation award
Nytro Ag Corp and Green Lightning recieved an innovation award at Ag in Motion 2025 for the Green Lightning Nitrogen Machine, which converts atmospheric nitrogen into a plant-usable form.
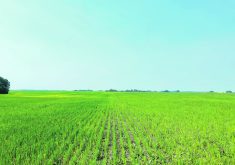
“If you have a canola field with a potential yield of 20 bushels, given everything else goes right from now until harvest, can you justify a fungicide application?
“But more importantly, how do you know that it really is a 20 bu. crop? Maybe it’s only 15 bu. or maybe it’s 30 bu. That’s the kind of questions Certified Crop Advisers get all the time. It’s their job to give a farmer the correct answer. They need to know how to arrive at the correct answer.”
Park said that while most students who pay $160 for the one-day diagnostic school are part of the CCA program, there are always a number of producers in each group who enrol because they want to do more accurate diagnoses on their own farms, without relying on the services of an outside agrologist.
In Manitoba, the school ran for 10 days in July, with each day hosting 30-40 students. This year, the crop yield calculation was a major component of the school.
“Most farmers and agrologists pride themselves in their ability to make good, close, yield estimates. And sometimes those visual guesstimates are right on,” Park said.
“One of the things we do in the school is get out into the field and do some visual estimates on wheat, flax, canola and other crops. Then we get into the crop and start counting and working the numbers in the yield calculator.
“We look at what builds a better yield at each stage and what can happen during the growing season to limit the yield before the combine finally arrives. It’s the kind of information that’s important in making good, sound management decisions. It’s a numbers game, but every number translates into dollars.”
He said the yield calculator often gets within a bushel or two of what the combine provides in the fall. The data and the formula in the school come directly from Manitoba Crop Insurance. It’s the same formula a crop adjuster would use to estimate a yield.
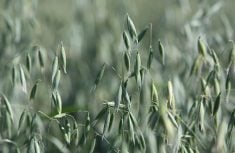
The cereal yield calculator deals with hard red spring wheat, hard red winter wheat, barley and oats. The wheats use the same formula. As Park walked through the wheat formula, he emphasized that each 160 acre field requires a minimum of eight sample sites to get an accurate yield prediction.
Each sample site is a square metre. Count the number of heads per square. In the field demonstration, Park came up with 490.
He then took a few representative heads and counted the kernels to determine the average number of kernels per head, which in this field came to 36 kernels.
Next, he multiplied the number of heads by the number of kernels, to arrive at 17,640 kernels per sq. metre.
The final step in the cereal yield calculator is to apply the kernels per bushel factor, which is 327 for both HRS and HRW. The bushel factor is a mathematical calculation designed to measure yield.
The result is a healthy looking wheat crop with the potential to yield 53.9 bu. per acre if nothing goes wrong.
The canola yield calculator is more complicated. In his field demonstration, Park counted 30 plants per sq. meter. Those plants had an average of 60 pods. Within the pods, there was an average of 30 seeds.
When he multiplied those three numbers together, Park arrived at an average of 54,000 canola seeds per square.
“This is where the canola formulas take a different turn than the wheat formulas. If we have an Argentine variety, we now plug in a factor of 86,000. If we have a Polish variety, we now plug in a factor of 131,000,” Park said.
“In our demo field, we have Argentine, so we now divide the number of seeds at 54,000 by the Argentine factor of 86,000. This gives us 0.6279 as the next step in the yield calculation.
“Now we multiply by the 44.1 factor, which is the same for Argentine and Polish. Our yield calculation tells us we have a 27.6 bu. per acre canola crop. Later this summer, we’ll check that 27.6 bu. number against the actual yield we get when we run the combine through the field.”
The canola calculator also includes a simple formula for estimating potential yield before pod formation.
In this formula, the demo site with 30 plants per sq. metre is factored by 85 percent to give a yield estimate of 25.5 bu.
Park said all the formulas have been ground truthed repeatedly and fine-tuned according to combine results. If the growing season continues without disaster, the yield calculator is close to the harvest reality.
However, the list of things that can go wrong is well known by producers.
Park said eight samples per quarter section is necessary because of the variability found in a typical field. Even when a person deliberately tries to pick representative spots, the numbers go up and down.
As for the timing, Park said, “yield calculators are appropriate at any point when you’re forced to ask that hard question ‘do I spend more money?’ You don’t want a visual guesstimate at that point in time. You need hard numbers.
“With canola, flowering is an ideal stage to calculate. With wheat, the best time is when it’s going into heading. But really, any day during the growing season is appropriate, as long as you’re still in a position to take action or else not take action to help that crop.”
After 10 days of school with different groups of farmers and crop advisers, Park was asked about the discrepancies between the crop yield calculator and the traditional eyeball method.
“Some of the farmers and crop advisers with the really good, long-term experience, and who really concentrate on the visual clues, can get extremely close to the actual yield. But let’s face it. We don’t all have that knack. It takes years and years to develop that skill, and some of us can never master it.
“But with the formulas, anyone who can count and use a pocket calculator can arrive at a very close estimate of a crop’s potential.”
The crop yield calculators will be posted later this summer on the Manitoba Agriculture website at www.cropdiagnostic.ca.