MIAMI, Man. – Every picture tells a story. And if the picture is based on data extracted from your field, it’s likely worth more than the proverbial 1,000 words.
Farmers Edge Precision Consulting is an independent crop consulting firm, based in Pilot Mound, Man. It specializes in extracting and manipulating data and then converting it into usable maps to make fields more profitable.
Farmers Edge certified crop advisor and co-owner Wade Barnes said one of the first steps when working with a new client is to create what he calls the analyzed map. This is eventually translated into the simpler zone map.
Read Also

VIDEO: Green Lightning and Nytro Ag win sustainability innovation award
Nytro Ag Corp and Green Lightning recieved an innovation award at Ag in Motion 2025 for the Green Lightning Nitrogen Machine, which converts atmospheric nitrogen into a plant-usable form.
“The analyzed map shows vegetative differences based on raw infrared satellite imagery,” Barnes said.
“This imagery is untouched. We don’t bother with a colour key because we might see 20 or 30 or more small, distinct areas on a typical half section. Those will be merged into larger management zones later once we get other information overlays.”
The company applies as many data layers as it can get including maps of yield, soil reconnaissance, salinity, drainage patterns and elevation. They even incorporate historical accounts into the data bank.
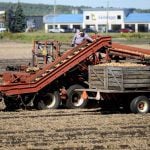
When they started working on the Perry Gemmill farm near Pilot Mound in 2005, there were no elevation maps for the east-west half section field designated as N 33-2-11. A quick fix for this problem was to have the client create an elevation map as he was applying fertilizer.
“Gemmill produced the topography map while he applied anhydrous,” Barnes said.
“He’s got a Zynx X20 controller and Zynx GPS. It’s the same kind of high end unit you find on Bourgault air seeders. He’s got it all hooked into a MidTech cold flow anhydrous controller. The mapping software is built right into his Zynx so he can do topography mapping on the whole farm as he puts down anhydrous.
“The elevation is probably not accurate enough for drainage in the Red River Valley, but it’s great for field mapping and identifying management zones. You need RTK for drainage in really flat areas.”
Next, the Farmers Edge software massages the analyzed map and other data layers to remove sharp edges. Barnes said small areas with similar characteristics are averaged and the edges are softened.
On N-33-2-11, they ended up with eight workable management zones. This becomes the zone map that will determine variable rate prescriptions. The zone map carries a colour key.
The soil reconnaissance map says the entire half section is Class 1 soil, so it should all be highly productive. It appears to be flat. So how does Barnes explain so many zones and the presence of extreme high and low productivity areas?
“Quite honestly, we were amazed to see so much variability on such flat land. But when we went searching for answers, we saw that the reconnaissance map was basically correct. This field should be uniformly good from corner to corner. But it’s extremely variable. What we discovered was that all the main variations are man-made.”
They found that the more productive west quarter had been in the family for a long time. Although Gemmill had farmed this quarter since he graduated from high school in the 1970s, he was not fully aware of the field’s history.
“This west quarter has traditionally been more productive than the east quarter,” Barnes said.
“It’s been Gemmill land for a long time and these guys have always been high input guys. Grandpa Gemmill was one of the first farmers to use fertilizer, so now we’re seeing quite a carryover effect.
“The east quarter was purchased by Gemmill more recently. It had not been a high input field. There had been a lot of stubble burning and summer fallow. The organic matter level is significantly lower today. Same with residual nitrogen.”
Barnes told Gemmill that the maps indicateded there had been farmyards and small fields located on the two quarters. Gemmill doubted it, but he was open to digging deeper.
When Perry’s father, David, entered the conversation, he looked at the map and quickly identified things that had happened before Perry was born.
The older Gemmill pinpointed the fenceline that had divided the two quarters, probably since settlement of the area. He located two farmyards, one at the north edge of each quarter, as well as pastures close to the yards and small fields that were once common.
David also gave the exact location of a 30 acre field at the far east edge on the map that had been summerfallowed during a dry year in the 1950s and the topsoil had blown away. This is an area that showed up as low productivity on the satellite image and the soil tests. Barnes said everything David talked about showed up on the maps.
“The old yard sites today have the potential to be very productive, but they have bad lodging problems every year. What they have under the surface here is old vegetable gardens, livestock barns, corrals, outhouses, hedgerows and other things that contribute to higher organic levels. A lot of the manure dumping would have taken place just south of these yard sites.
“The highest spots in the field are only three feet (one metre) higher than the lowest spots, but they have greatly reduced organic matter and they’re lower in sulfur. But when we come off those little ridges, the sulfur levels go straight through the roof.”
Barnes explained that the degree of detail or variable rate precision put into a map depends on each farmer and how complex he wants to be in managing inputs. On the Gemmill farm, Barnes used eight zones and then grouped them into four larger categories. Here are the groups.
Zone 1
These are low spots with some salinity, defined by a natural drainage run across the lower left corner of the map. Gemmill normally farms through this low area without a problem, but the 2004 satellite base map for N-33-2-11 shows a wet spot at the south end of the west quarter.
“Zone 1 isn’t really all that bad. It yields 30 bushels of canola while the best areas in this field yield 75 bushels of canola, so it’s all relative. We shoot for a 60 bushel canola average across the whole 320 acres.”
Zones 2 & 3
This had been a separate field at one time and is the spot where the topsoil had blown away in the 1950s. It has a long way to go before it can be considered highly productive.
Zones 4, 5 & 6
“These zones can grow 75-bushel canola,” said Barnes. “This is where Perry has the biggest potential for economic improvement. He used to put down 80 pounds or maybe 95 lb. of nitrogen. But the soil deserves 130 lb., so that’s what we’re doing now.”
Zones 7 & 8
“The economic benefit in these two zones comes from reduced inputs. We can cut the nitrogen at least in half and in many spots we can cut it to zero with no yield penalty.”
While Gemmill wasn’t comfortable with such dramatic cuts, he said the system is working great.
“We got the same yields with zero nitrogen as we got with 100 lb.”
Barnes said a common reaction from producers is they’ve bought into the idea of isolated spots with high residual nitrogen, but they don’t know how long they can cut back on fertilizer.
They want to know how many years they can rob Peter to pay Paul.
“Our answer is you might do it forever. I’m convinced we can go forever with zero nitrogen fertilizer on these high organic spots and still get high yields.
“We go into those areas to soil test in the fall after a high yield crop and we still get 100 lb. of residual nitrogen. Once you’ve identified those high organic areas, you can continue to get top yields with no nitrogen.”
Barnes said that in the right conditions, each one percent of organic matter provides 15 lb. of residual nitrogen.
“In 2003, we saw 19 lb. of residual nitrogen for every one percent organic matter. In 2004, we had a cool, moist summer and we saw only four lb. residual nitrogen for every percent organic. We had a more normal year in 2005, and we got eight lb. residual nitrogen.
“It’s too early to say for sure, but I think 2006 will again see high levels of residual nitrogen.”
He said soil sampling must be strictly zone-related if it’s going to give an accurate picture of what’s going on in a field.
Farmers Edge usually aims for about five acres per core sample, but taking each sample from a precise zone location and keeping it identified as such is more important than the size of the area.
Independence
Barnes said independence is the key to giving farmers good advice. Farmers Edge is not affiliated with any agricultural supplier.
“We are neutral on all fronts, even when it comes to making purchase recommendations on hardware and software. We look at what a guy has and what he needs to do and then run through the list of what might work.”
He will consider John Deere, Zynx, Outback, Ag Leader or any other product that has a good fit for a specific farm. The same applies to soil labs.
“We use A and L, AgVise or any other lab a farmer wants. We try to keep a guy with the same soil lab he’s been comfortable with all along, unless there’s a good reason for changing.
“The labs themselves are actually very similar. As long as they use the same extraction process, the results are almost always bang on identical.
“The differences are in their philosophies on making fertilizer recommendations. But, quite honestly, that should never be the job of a soil lab. That’s the job of the farmer and his agronomist.”
Contact Wade Barnes at 204-825-2331 or farmersedge@met.net.