If a producer has a load of grain coming off the field at 35 C in August or is loading a Super B with grain at the freezing point in December, he is out of luck if he expects the 919 moisture meter to give an honest reading right off the bat. The charts from the Canadian Grain Commission don’t extend below 11 C or above 30 C.
A producer has to wait for hot grain to cool and cool grain to warm. In both cases, he can’t help but question whether the moisture level remains stable. Waiting for grain to cool or warm is not how farmers want to spend their time.
Read Also
VIDEO: Green Lightning and Nytro Ag win sustainability innovation award
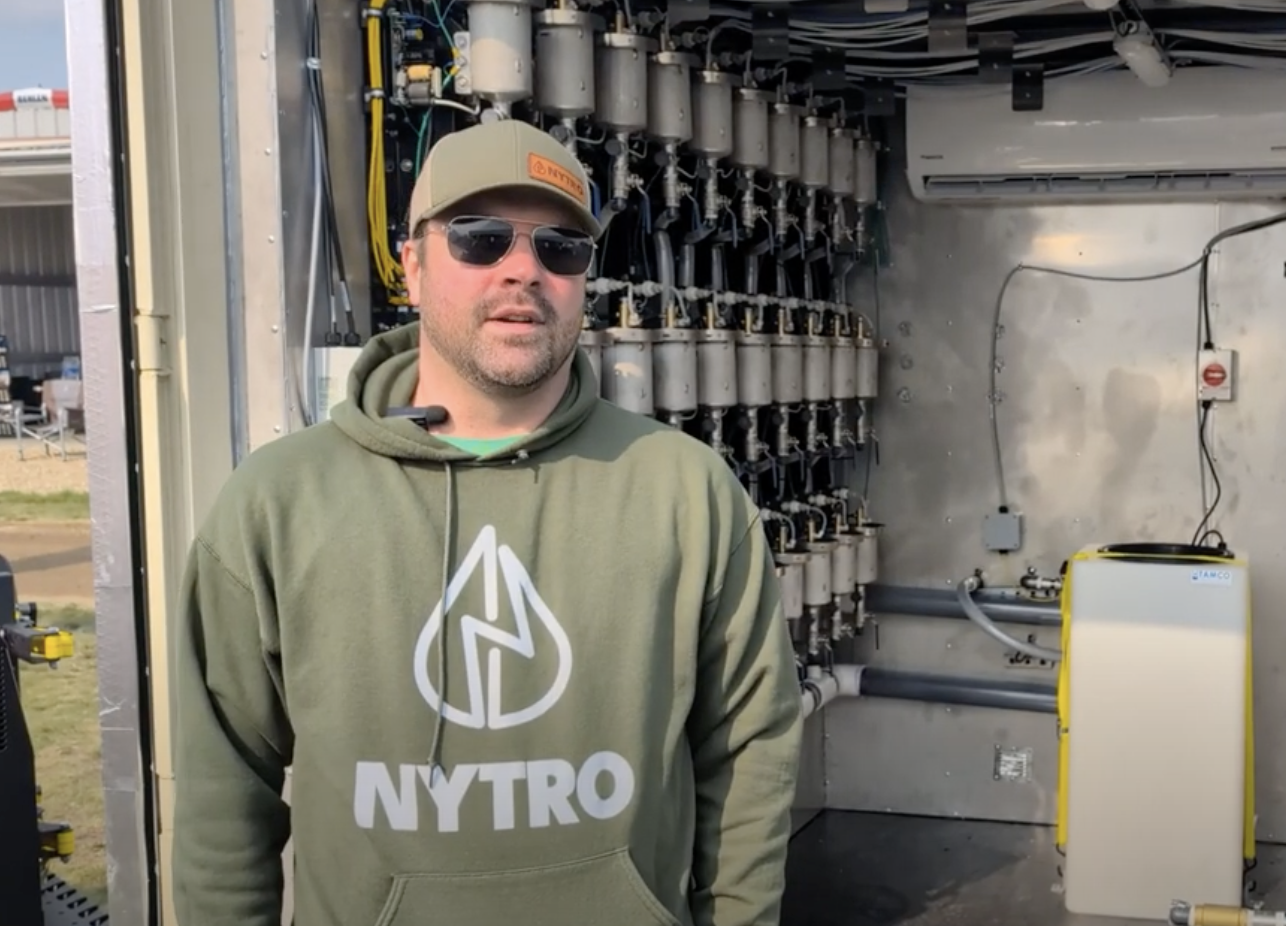
Nytro Ag Corp and Green Lightning recieved an innovation award at Ag in Motion 2025 for the Green Lightning Nitrogen Machine, which converts atmospheric nitrogen into a plant-usable form.
The common practice with hot grain at 35 C is to read the thermometer and then study the charts to find the spread between
25 C and 30 C. It seems logical to apply that numerical difference to the spread between 30 and 35 C.
The same flawed practice is used at the low end of the temperature readings.
“That trick does not give you the correct answer,” said Jason Diehl of Dimo’s Labtronics in Winnipeg, the company that manufactures the 919 moisture tester.
“It is not valid because the charts are not all linear regressions. Some charts are quadratic. As grain temperatures move below 11 or above 30, the numbers go out of synch pretty quickly if you use equations from the wrong temperature range, even if it’s the nearest temperature range.
“But that’s how guys have been doing it for 50 years if their grain temperatures are too high or too low for the charts.”
Some producers speculate that the correct equations for higher and lower temperatures have been available since the charts were created in the 1950s, but the pages were too small to hold the complete set of information.
That’s where electronics come into play, said Diehl. A computer can handle a much wider spreadsheet than printed paper. Dimo’s Labtronics has programmed in the complete Canadian Grain Commission equations for the 10 degrees C above and below the conventional printed charts.
“We can now very easily access the correct grain commission formulas for grain up to 40 C and right down to the freezing point,” Diehl said.
“We’ve installed all that information into a stand-alone, handheld unit we call the Model 919TM Smart Charts. Basically, what we’ve done is use the computer to stretch the charts beyond the boundaries of the printed page. It’s simply the logical extension of the correct equations already formulated by the commission.”
Smart Charts software includes all the regular 919 moisture conversion charts, plus the extended temperature ranges.
In addition, the software has test weight conversion charts going from grams per half litre into pounds per bushel. Diehl said the new machine relegates the old paper charts to museum status.
When using Smart Charts, a producer first selects either a moisture or test weight determination. If moisture test is selected, then pick the commodity and enter the dial drum reading from the model 919 along with the grain temperature. Percentage of moisture will be displayed on the large LCD display.
“On some of the old paper charts, their dial drum number ends at 79. But when a producer is taking off really wet crop, he needs the whole range. Guys will call and ask what they can do. Well, now we have an answer for them because the Smart Charts includes the entire range. The numbers don’t stop because we run out of paper.”
If a producer selects test weight determination, he picks the commodity and enters the grams per half litre as determined by using the half litre measure and ABS Cox funnel. Test weight is then displayed in either kg per hectolitre or lb. per bu.
“With either procedure, farmers no longer need to thumb through the existing paper charts, which contain vast amounts of data points that are small in size in order to fit all the information on a couple of pages. Also, it’s completely updatable when changes or amendments of the conversion charts occur.”
Diehl said if a sample is beyond the range of the electronic charts, the Smart Charts notes it. Rather than give a wrong reading, it will indicate too hot or too cold. It will then give an estimate of the moisture, but with the disclaimer that it is only an estimate.
“It won’t be far off, but it will only be an estimate,” said Diehl.
The self-contained Smart Charts does not need a laptop or hookup to the 919. Everything is in one unit. Because not many farmers need the full list of 50 charts, there is a bookmark feature so the most common half-dozen commodities for each farm can be accessed quickly.
Cost of the Model 919TM Smart Charts is $249. The first 45 units will be available for sale in September.
For more information, contact Jason Diehl at 204-772-6998.


