Everyone’s talking about whether soybeans have peaked, with brutal selloffs in the past couple of days.
Bears say yes of course we have peaked and are selling off, with demand destruction compensating more than adequately for reduced potential in the U.S., and that the drought impact went overboard and is now being reeled in.
Bulls say this is just plain stupid right now, that soybeans are about to go into a negative stocks-to-use for 2012-13 and that much higher relative prices will be needed to bring that back in balance. This is a correction and will end soon.
Read Also

Farmer ownership cannot be seen as a guarantee for success
It’s a powerful movement when people band together to form co-ops and credit unions, but member ownership is no guarantee of success.
What do I think? I’d be surprised if we have seen the peak of soybeans and am more on the bull side. I don’t see Goldman Sachs’ call of $20 beans to be unlikely. But what do I know? I’m not a trader or fulltime analyst and my hunches are often way off-base. For instance, I have been predicting that humanity would become completely sick of American Idol for the past half dozen years, yet the crap still keeps bring in views in droves. (Including my wife, hence my psychological pain.) And I have been loudly calling for the Winnipeg property housing bubble to pop for half a decade, and that makes me the wrongest man on earth. (Fortunately I bought a house before the boom and am sitting on a pile equity on paper which I don’t think should be there.)
So I’m definitely not the guy who’s going to successfully pick the peak of the soybean market, upon which our canola prices so heavily depend.
But can anyone safely declare that the soybean rally is going bust? If you look at it on a simple, short term chart it appears like a classic peak and fall.
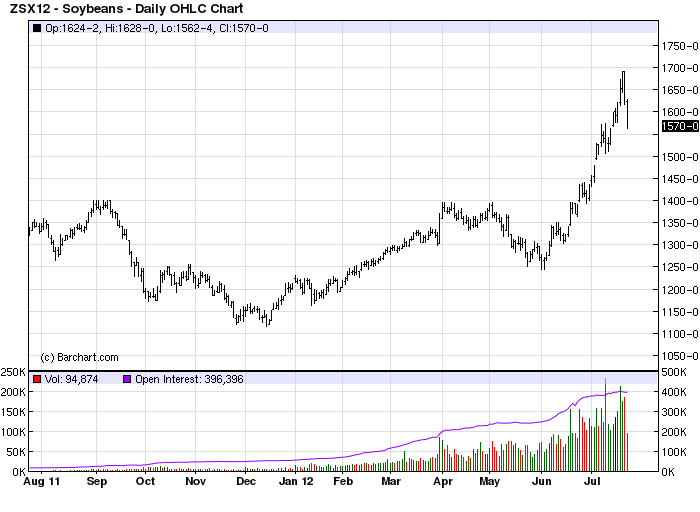
Up like a rocket, till the thrusters cut. Then: “Hello Earth!”
But if you play with charts a bit, you can make the events of the past couple of days seem not so incredible. Here’s some fun I had this morning with running Nov soybeans through a bunch of exponential moving averages. Notice how the soybean slump seems big when you’re close to it, but not so biggy when you’re a little ways away from it.
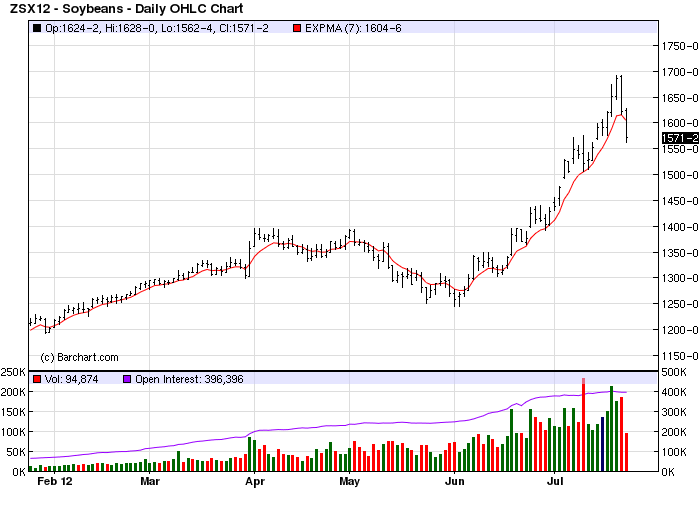


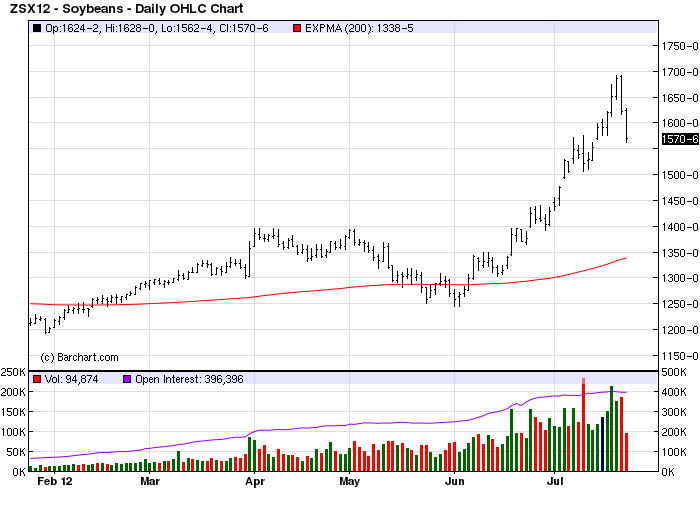
This is just a bunch of charts I chucked together in five minutes so don’t base anything on them. But they’re a useful way of demonstrating how short term market movements can seem pretty small when put in a broader context.
The first chart makes soybeans look like they’ve definitely gone off the rails. Way off. Leap off of that train if you can!
The second shows soybeans just touching the moving average. That doesn’t suggest much unless it crosses and stays under.
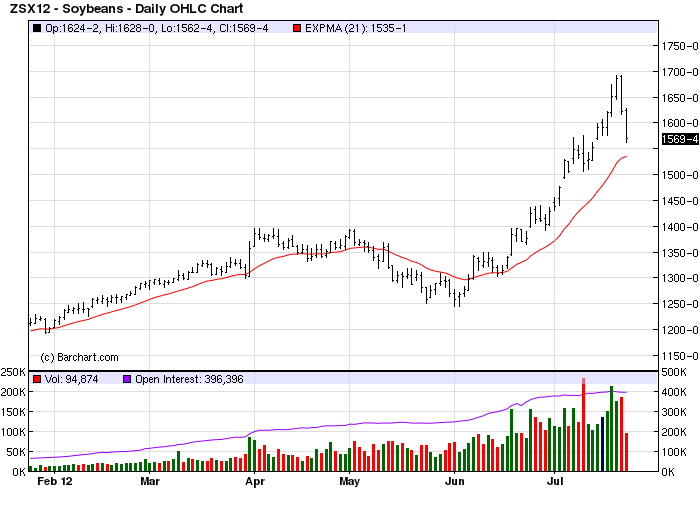
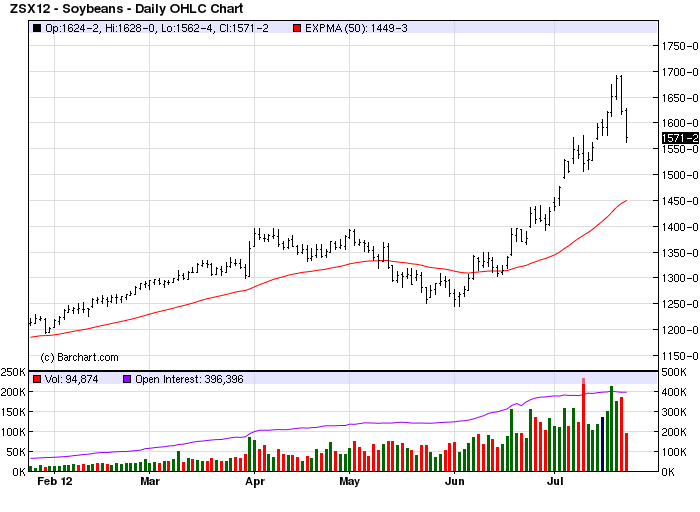
The third and onwards don’t suggest the uptrend has necessarily been broken. (The 50 and 200 day moving average charts are completely useless in a fast-moving market, but I just put them up there as pieces of eye-candy.)
I could have done this little thought exercise with Bollinger bands or a host of other measures, but you get the idea, right? These violent actions in the markets can signal something long-term significant, such as the blow-off and collapse of a market, or they can just be some loud background noise inside a longer trend.
Which is it this time? Someone’s gonna call it right and be lauded as a far-sighted hero, but I think the reality is that it’s very far from a settled question. Just like the question of whether American Idol will be stronger or weaker from swapping out J Lo for Mariah Carey. (If you charted Carey’s career you’d get a parabolic rise, blow-off and collapse, then a gradual bull trend developing. As I finish writing this I see soybeans contracts are limit-down across the board, so perhaps we’re in the soybean version of the bad part of the Carey career.)