As the canola market tumbles from 2009-10 highs set in December, producers might ask themselves why they didn’t sell more back then.
Larry Weber of Weber Commodities in Saskatoon thinks the rally into December was not only a good opportunity to sell crop in the bin, but also to lock in prices for 2010-11 crop.
In December, you could have locked in $10 per bushel canola for the next crop, Weber told the Saskatchewan Canola Growers meeting at Crop Production Week in Saskatoon.
A $10 price is 50 cents to $1.50 more than Weber’s price forecast for 2010-11.
Read Also
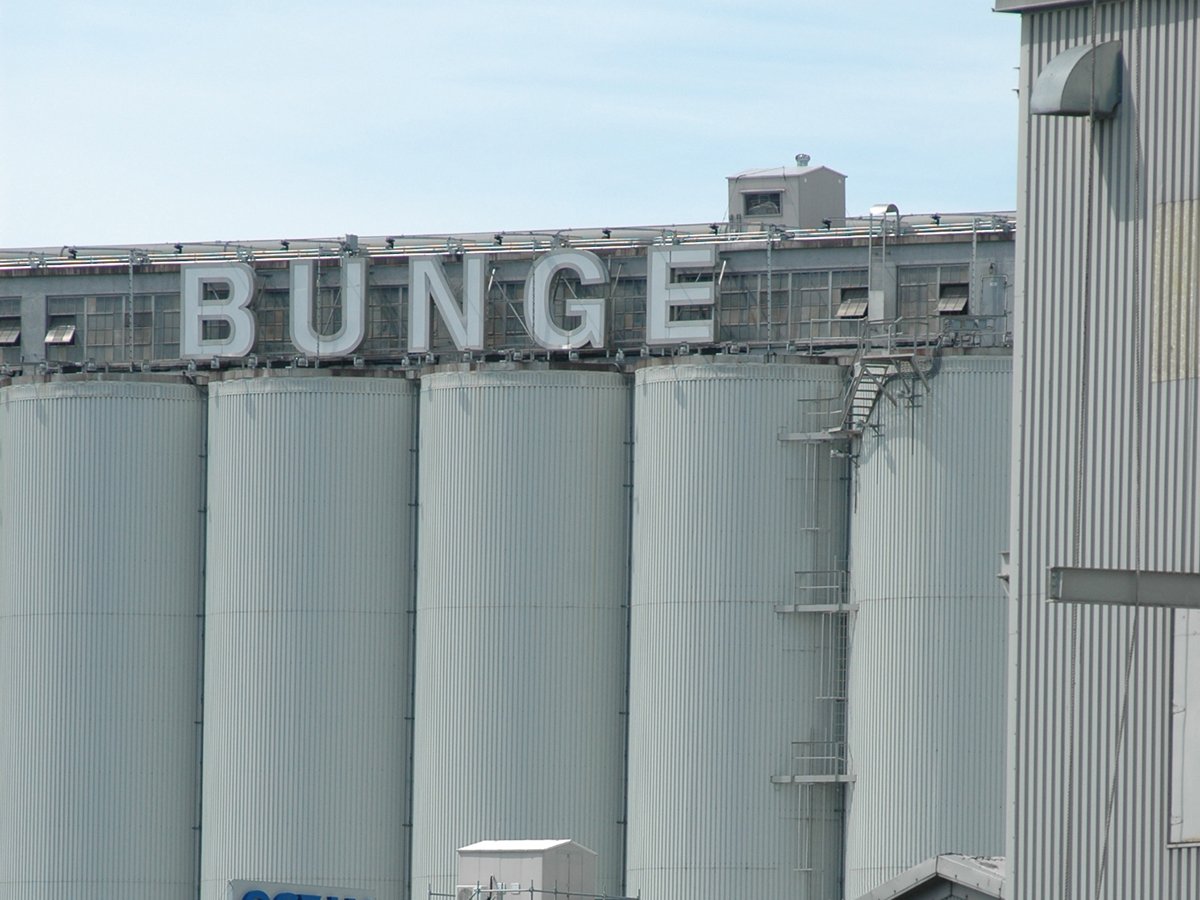
Bunge’s crop mix is changing
Bunge has predominantly been a soybean processing firm, but that’s about to change after the merger with Viterra with softseed processing and grain merchandising gaining ground.
Few western Canadian farmers likely considered the option and that sets them apart from American and Ontario producers, he said.
There are risks to pricing crop ahead of production but there are also risks to leaving it unpriced. As Weber noted, brokers can help farmers use risk reduction marketing tools to take advantage of early pricing opportunities.
A constant challenge for farmers selling crop is determining what is a good price. With the wild market gyrations of the past couple of years, that is becoming more difficult.
Sticking in everyone’s mind now is the $740 per tonne that the market peaked at in 2008, but in the 15 years between 1994 and now, two thirds of the time the price was below $410.
Weber said a simple technical tool that can help identify when markets are peaking or bottoming and when they are likely to reverse direction is the Relative Strength Index.
The RSI assumes that in rising markets, prices close higher each day and in falling markets they close lower. It uses a calculation to compute the ratio of higher closes to lower closes.
Don’t worry, you don’t have to do the calculation. Commodity market charts on the internet, including those available free on www.producer.com, allow you to select RSI as an indicator.
The RSI will show up under the chart of futures price movements. It appears as a line on a graph that runs from zero to 100. When the line reaches 70, the market is considered oversold and when it falls to 30, it is under sold.
When canola futures fell in September because warm weather was allowing the late harvest to proceed, the RSI fell below 30, indicating it was not a good time to sell.
As the market climbed on snow hitting the U.S. Midwest in November and December and hindering harvest, the RSI for canola climbed as high as 82, indicating a strong price that was not likely to last long.
Weber said that by watching the RSI and becoming familiar with it, farmers could avoid selling at the market lows.