Statistics Canada’s post-harvest production report supported canola prices and sets up the potential for the tightest year-end stocks in years.
The reduction in the canola estimate to 18.7 million tonnes from the 19.4 million forecast in September was lower than the average of analysts’ pre-report expectations.
But it was not a surprise if you followed the final yield estimates of the Alberta and Saskatchewan crop reports in the fall.
Those reports, particularly the Alberta one, were significantly lower than the numbers in the Statistics Canada September report.
Read Also

VIDEO: Ag in Motion documentary launches second season
The second season of the the Western Producer’s documentary series about Ag in Motion launched Oct. 8.
The Statistics Canada report provided welcome reinforcement for the canola January futures price, which had been weakening along with the soybean complex on news that Brazil and Argentina were getting much needed rain.
The La Nina in the Pacific has contributed to a widespread drought in South America this season. Last week’s rain and more showers expected this week were desperately needed.
However, moisture deficits remain and some areas are still waiting for rain so they are not out of the woods. December-January is the height of their growing season when moisture needs are greatest.
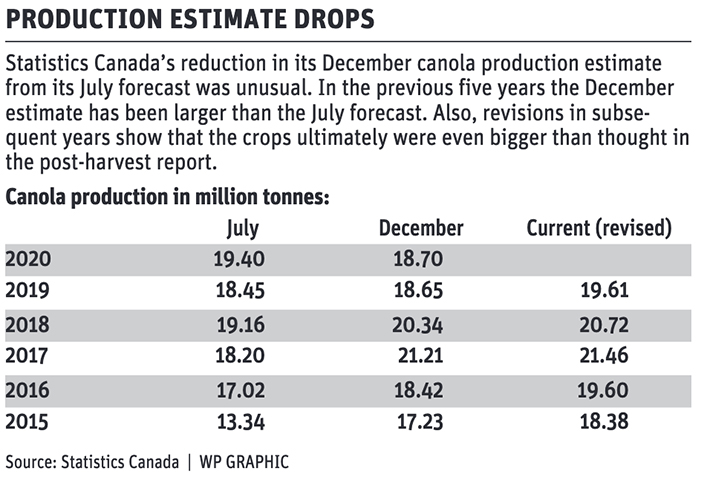
Getting back to the Statistics Canada report, the reduction in the canola estimate was unusual in a historical context.
In each of the previous five years, the December estimate has been larger than the July forecast.
The July and December reports are based on farmer surveys so it appears that producers are cautious in their reports in summer and the crop usually turns out better than expected.
If we compare December to the September model-based forecast, we see that the December number was bigger in 2015, 2016 and 2017, but smaller in each of the following three years.
Even the December report in most years turns out to be conservative.
That report is called the “final” one for the year, but the numbers are revised in subsequent reports to account for updated distribution data.
In each of the past five years, canola production has been revised upward from the December reports.
The revisions for the 2017 and 2018 crops were fairly small but the ultimate tallies for the 2015, 2016 and 2019 crops were a million tonnes or more larger than the December estimate in the production year.
We sometimes hear criticisms that Statistics Canada overestimates crops based on a nefarious “cheap food policy” but in reality the numbers show that if anything, the agency consistently underestimates the size of the canola crop.
But putting aside such debates, the current December estimate of 18.72 million tonnes is now the “official” number that will be slotted into updated supply and demand spreadsheets.
It is 683,000 tonnes less than the September forecast.
Meanwhile the canola export total to Nov. 29 is 4.24 million tonnes, up 38 percent over the same point last year.
The domestic use picture is also strong at 3.45 million tonnes, almost the same as last year.
These are new numbers that analysts at Agriculture Canada, who update the supply, demand and year-end stocks forecast spreadsheet each month, can’t ignore.
Their November report was conservative, using the Statistics Canada September production forecast and keeping their own full-year export forecast steady with last year despite the booming shipments in the first quarter of the crop year.
Even with that, they pegged the year-end carryout at 2.23 million tonnes, the lowest since 2016-17’s 1.34 million. In the next monthly update, I would think Agriculture Canada would revise its closing stocks forecast down close to that 2016-17 number.
It is notable that until last week, the highest recent canola futures price was just over $582, set in July 2017, the last month of the 2016-17 crop year.
Last week, the nearby futures contract broke above that and carried on to more than $590 even as the Canadian dollar rallied to a two-year high at more than 78 U.S. cents.
Where might we go from here? I don’t make predictions but I’ll note some history.
Canola ending stocks were less than one million tonnes in 2011-12 and 2012-13 and canola prices in the period were often above $600 per tonne.
Back then, canola was well-supported by exceptionally tight U.S. and world soybean stocks-to-use ratios.
The U.S. stocks-to-use ratio then was five percent or less. It is forecast to be 4.2 percent this year. The global stocks-to-use ratio back then was about 22 percent. It is forecast at 23.4 percent this year.
Oilseed prices are also currently supported by the highest palm oil values in eight years, driven higher by weather and labour problems. Also Indonesia has increased export levies and taxes that will limit the amount it sends offshore.
On the other hand, oilseed markets are overbought. Almost all players are “betting” on higher prices. An overweighted market is vulnerable to sharp sell-offs whenever news such as rain in South America is forecast.
Some analysts also note recent slower U.S. soybean exports sales to China as a threat. Generally, some wonder if global demand is front loaded into the first half of the crop year as countries built a stocks buffer to insure against potential further COVID-19 disruptions. If true, that might mean slower sales in the second half. Also, current high oilseed prices will ration demand for some customers.
On the COVID-19 front, case numbers are climbing in North America and Europe but markets have been buoyed by good news about vaccine approvals. But if the vaccination rollout hits snags and is delayed, it would dampen optimism.
Another risk to canola prices is the potential for rail trouble in Canada. The railways have moved record amounts of grain this season but in recent weeks pipeline protesters in Vancouver have twice blocked rail lines serving the north shore for a few hours, causing network disruptions.


