
For a change it was wheat that lead commodities higher. A combination of factors lead markets to conclude that wheat wasn’t going to be as plentiful over the next grain year as it has been.
Wheat on Chicago ended up US 32-5 cents per bushel in the face of droughty conditions in Europe. A grain production tour in North and South Dakota by the Wheat Quality Council is suggesting that USDA estimates of 48 bushels per acre for this crop are way out bounds to the upside. After day one of the tour, which has in the past yielded an estimated average of about 45 bushels, it starts in the southern part of the state, it found only 39. This is a bushel higher than last year during a record drought.
Read Also
Most of Manitoba harvest wraps up for 2025
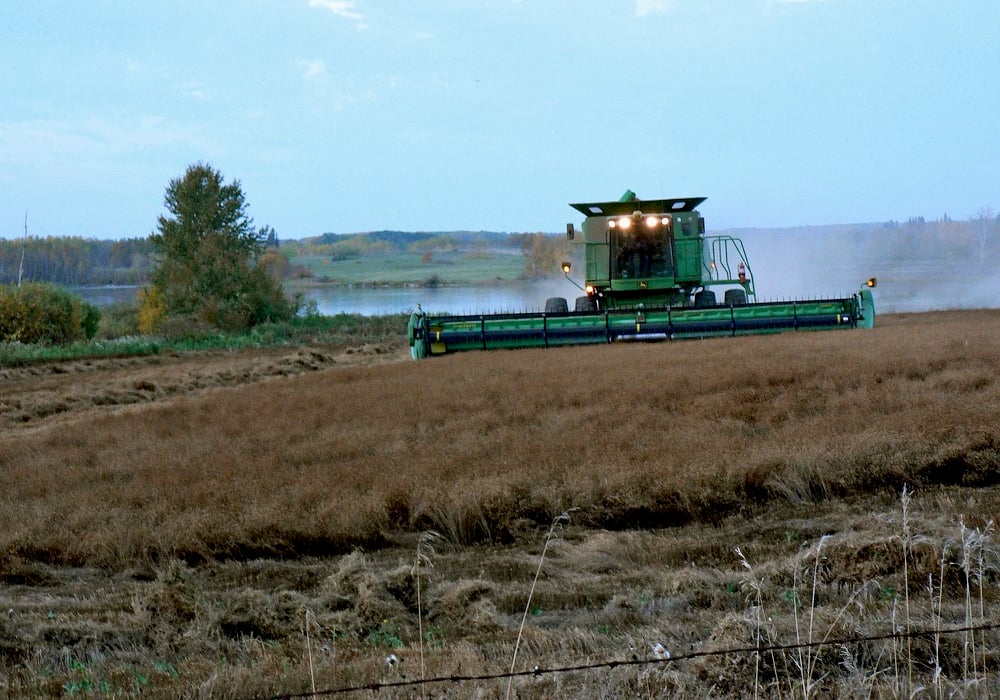
Manitoba Agriculture issued its final crop report of 2025, showing the overall provincewide harvest at 97 per cent complete as of Oct. 20. Nearly all major crops have finished combining, with 37 per cent of Manitoba’s sunflowers finished, plus 71 per cent of grain corn and small amounts of soybeans and potatoes left to do.
Traders and analysts had suggested that wheat was near or at the bottom of the Markets’ cycles earlier this month, leaving little room to move but up.
Canola appeared to feel the upward tug from wheat, and along with soybeans, moved higher. Canola gains were tempered by the Canadian dollar before the trading day was done and finished slightly below yesterday, with November posting a C$498.50 for the day, down 40 cents per tonne.
Corn was up 6 US cents per bushel on the day. Cattle and hogs were up, along with all coarse grains, leaving canola the only commodity to end lower.
| Name / Contract | High | Low | Last | Change | Settlement |
| Canola Nov 2018 (updated 1:19PM(CST) on 7/25/2018) | 492.80 | 487.70 | 489.50 | -0.40 | 489.50 |
| Canola Jan 2019 (updated 1:17PM(CST) on 7/25/2018) | 499.00 | 494.70 | 495.80 | -0.20 | 495.80 |
| Canola Mar 2019 (updated 1:14PM(CST) on 7/25/2018) | 504.50 | 500.70 | 501.40 | -0.50 | 501.40 |
| Canola May 2019 (updated 1:14PM(CST) on 7/25/2018) | 508.90 | 505.50 | 506.20 | -0.50 | 506.20 |
| Canola Jul 2019 (updated 1:14PM(CST) on 7/25/2018) | 511.00 | 507.70 | 508.30 | -0.50 | 508.30 |
| Soybeans Aug 2018 | 863.00 | 852.00 | 861.25 | 3.25 | 860.75 |
| Soybeans Sep 2018 | 868.00 | 857.50 | 866.50 | 3.00 | 866.00 |
| Soybeans Nov 2018 | 878.00 | 866.75 | 876.50 | 3.25 | 875.75 |
| Soybeans Jan 2019 | 888.25 | 877.25 | 886.75 | 3.00 | 886.25 |
| Soybeans Mar 2019 | 897.75 | 886.50 | 896.50 | 3.50 | 895.75 |
| Soybeans May 2019 | 906.50 | 895.75 | 904.50 | 2.25 | 904.75 |
| Soybean Meal Aug 2018 | 331.10 | 327.40 | 331.00 | 2.10 | 330.00 |
| Soybean Meal Sep 2018 | 330.40 | 326.60 | 330.20 | 2.20 | 329.40 |
| Soybean Meal Oct 2018 | 329.80 | 326.00 | 329.80 | 2.50 | 328.80 |
| Soybean Oil Aug 2018 | 28.47 | 28.17 | 28.41 | 0.17 | 28.41 |
| Soybean Oil Sep 2018 | 28.57 | 28.26 | 28.51 | 0.17 | 28.51 |
| Soybean Oil Oct 2018 | 28.63 | 28.32 | 28.62 | 0.22 | 28.61 |
| Corn Sep 2018 | 360.00 | 352.00 | 358.25 | 6.25 | 359.25 |
| Corn Dec 2018 | 374.00 | 366.00 | 372.25 | 6.25 | 373.25 |
| Corn Mar 2019 | 385.00 | 377.25 | 383.00 | 5.75 | 384.25 |
| Corn May 2019 | 391.00 | 383.25 | 389.25 | 5.50 | 390.25 |
| Corn Jul 2019 | 396.75 | 389.75 | 394.75 | 5.00 | 396.00 |
| Oats Sep 2018 | 233.00 | 229.50 | 232.50 | 2.00 | 232.25 |
| Oats Dec 2018 | 239.50 | 236.00 | 239.25 | 2.25 | 239.00 |
| Oats Mar 2019 | 244.00 | 242.50 | 243.50 | 2.00 | 243.50 |
| Oats May 2019 | 245.25 | 245.25 | 245.25 | 2.00 | 245.25 |
| Oats Jul 2019 | 250.25 | 250.25 | 250.25 | 2.00 | 250.25 |
| Wheat Sep 2018 | 545.25 | 511.25 | 542.00 | 31.75 | 542.75 |
| Wheat Dec 2018 | 564.25 | 530.50 | 561.25 | 32.00 | 561.75 |
| Wheat Mar 2019 | 579.50 | 547.50 | 576.25 | 29.75 | 576.75 |
| Wheat May 2019 | 585.75 | 556.75 | 583.00 | 27.75 | 583.50 |
| Wheat Jul 2019 | 587.00 | 558.25 | 583.50 | 24.75 | 584.25 |
| Spring Wheat Sep 2018 | 592.50 | 554.50 | 587.25 | 32.50 | 587.25 |
| Spring Wheat Dec 2018 | 608.00 | 572.50 | 603.00 | 30.50 | 603.00 |
| Spring Wheat Mar 2019 | 622.00 | 591.50 | 617.50 | 28.75 | 617.50 |
| Spring Wheat May 2019 | 628.75 | 610.75 | 624.75 | 26.75 | 624.75 |
| Spring Wheat Jul 2019 | 632.75 | 620.00 | 631.50 | 25.00 | 631.50 |
| Hard Red Wheat Sep 2018 | 544.75 | 510.00 | 538.50 | 28.75 | 540.75 |
| Hard Red Wheat Dec 2018 | 570.25 | 536.50 | 564.00 | 28.50 | 566.25 |
| Hard Red Wheat Mar 2019 | 587.00 | 555.00 | 581.00 | 27.00 | 583.00 |
| Hard Red Wheat May 2019 | 594.50 | 559.00 | 590.00 | 27.25 | 591.00 |
| Hard Red Wheat Jul 2019 | 596.50 | 566.00 | 591.25 | 25.25 | 592.75 |
| Live Cattle (P) Aug 2018 | 109.67 | 107.75 | 109.67 | 1.62 | 109.02 |
| Live Cattle (P) Oct 2018 | 111.25 | 109.58 | 111.22 | 0.89 | 110.78 |
| Live Cattle (P) Dec 2018 | 114.93 | 113.98 | 114.93 | 0.31 | 114.80 |
| Feeder Cattle (P) Aug 2018 | 153.12 | 151.85 | 152.98 | 0.23 | 152.83 |
| Feeder Cattle (P) Sep 2018 | 153.75 | 152.45 | 153.52 | unch | 153.25 |
| Feeder Cattle (P) Oct 2018 | 154.90 | 153.58 | 154.52 | -0.03 | 154.45 |
| Lean Hogs (P) Aug 2018 | 66.75 | 65.58 | 66.22 | 0.67 | 66.40 |
| Lean Hogs (P) Oct 2018 | 54.10 | 52.62 | 53.85 | 1.33 | 53.92 |
| Lean Hogs (P) Dec 2018 | 49.00 | 47.70 | 48.88 | 1.36 | 48.92 |
| Canadian Dollar Aug 2018 | 0.7669 | 0.7615 | 0.7662 | 0.0060 | 0.7662 |
| Crude Sep 2018 | 69.70 | 68.20 | 69.39 | 0.87 | 69.30 |


