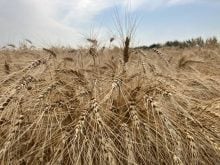
Wheat was the only crop futures to rise on Thursday.
Canola was weighed down by a stronger loonie, profit taking after recent gains and the weaker soybean complex.
Chicago wheat futures rose for the fifth straight session on technical buying and worries over potential yield losses due to dry weather in parts of the U.S. Plains as the crop comes out of winter dormancy.
The weekly U.S. Drought Monitor showed 70 percent of Oklahoma and 45 percent of Kansas, both top-producing states, were classified as in “moderate drought.”
Read Also

U.S. grains: Soybean futures hit one-month high on U.S.-China trade hopes
Chicago Board of Trade soybean futures hit their highest level in a month on Monday on renewed optimism over U.S.-China trade talks after U.S. President Donald Trump said he believed Beijing would agree to a soybean trade deal and will buy U.S. soy again.
Funds hold a sizable net short position in CBOT wheat, leaving the market open to short-covering.
Gains in Minneapolis spring wheat were much less than in Chicago.
The U.S. Department of Agriculture reported export sales of U.S. wheat in the latest week at 445,200 tonnes for 2014-15 and 48,000 tonnes for 2015-16, near the high end of trade expectations.
Consultancy Strategie Grains cut its outlook for EU soft wheat exports this season by 2.5 million tonnes to 30 million, citing the impact of lower oil prices on importing countries in North Africa and the Middle East, Reuters reported.
Chicago soybean futures fell, shrugging off talk overnight that China bought two cargoes of U.S. soybeans as the weekly weekly export sales report was disappointing.
It said export sales fo of soybeans were 198,700 tonnes (old-crop and new-crop combined), below forecasts ranging from 300,000 to 600,000 tonnes.
A drop in crude oil weighed on soyoil futures, which closed lower for the sixth time in seven sessions.
Corn was lower on disappointing weekly export sales which were down about 50 percent from the week before.
However, exports to date are enough to keep up with the U.S. Department of Agriculture’s fully year export forecast.
Light crude oil nearby futures in New York were down $1.12 to US$47.05 per barrel.
The Canadian dollar at noon was US78.80 cents, up from US78.35 cents the previous trading day. The U.S. dollar at noon was C$1.2691.
The Toronto Stock Exchange’s S&P/TSX composite index was up 31.52 points, or 0.21 percent, at 14,770.72.
Dow Jones industrial average rose 258.74 points, or 1.47 percent, to 17,894.13, the S&P 500 gained 25.64 points, or 1.26 percent, to 2,065.88 and the Nasdaq Composite added 43.35 points, or 0.89 percent, to 4,893.29.
Winnipeg ICE Futures Canada dollars per tonne
Canola Mar 2015 458.70 -5.80 -1.25%
Canola May 2015 463.70 -5.80 -1.24%
Canola Jul 2015 459.10 -5.40 -1.16%
Canola Nov 2015 447.10 -4.30 -0.95%
Canola Jan 2016 448.80 -4.30 -0.95%
Milling Wheat Mar 2015 229.00 +1.00 +0.44%
Milling Wheat May 2015 236.00 +1.00 +0.43%
Milling Wheat Jul 2015 239.00 +1.00 +0.42%
Durum Wheat Mar 2015 333.00 unch 0.00%
Durum Wheat May 2015 323.00 unch 0.00%
Durum Wheat Jul 2015 313.00 unch 0.00%
Barley Mar 2015 182.00 unch 0.00%
Barley May 2015 184.00 unch 0.00%
Barley Jul 2015 186.00 unch 0.00%
American crop prices in cents US/bushel, soybean meal in $US/short ton, soy oil in cents US/pound
Chicago
Soybeans Mar 2015 986.5 -2.5 -0.25%
Soybeans May 2015 990.5 -2.25 -0.23%
Soybeans Jul 2015 994 -3 -0.30%
Soybeans Aug 2015 991.75 -3.5 -0.35%
Soybeans Sep 2015 977 -3.5 -0.36%
Soybeans Nov 2015 967.5 -4 -0.41%
Soybean Meal Mar 2015 343.5 -2.2 -0.64%
Soybean Meal May 2015 331.6 -1.7 -0.51%
Soybean Meal Jul 2015 328.6 -1.2 -0.36%
Soybean Oil Mar 2015 30.76 -0.21 -0.68%
Soybean Oil May 2015 30.87 -0.23 -0.74%
Soybean Oil Jul 2015 31.05 -0.23 -0.74%
Corn Mar 2015 382.25 -1.75 -0.46%
Corn May 2015 388.5 -2.5 -0.64%
Corn Jul 2015 395.75 -2.75 -0.69%
Corn Sep 2015 403 -2.75 -0.68%
Corn Dec 2015 411.75 -2.5 -0.60%
Oats Mar 2015 279.75 -0.75 -0.27%
Oats May 2015 281.25 -0.75 -0.27%
Oats Jul 2015 283.25 -1.25 -0.44%
Oats Sep 2015 286.25 -1.75 -0.61%
Oats Dec 2015 283 -2 -0.70%
Wheat Mar 2015 513.25 +10.25 +2.04%
Wheat May 2015 507.25 +8.25 +1.65%
Wheat Jul 2015 509.5 +7.75 +1.54%
Wheat Sep 2015 518.5 +7.5 +1.47%
Wheat Dec 2015 531.5 +6.75 +1.29%
Minneapolis
Spring Wheat Mar 2015 556.75 +2.25 +0.41%
Spring Wheat May 2015 569.5 +2.5 +0.44%
Spring Wheat Jul 2015 575 +2.25 +0.39%
Spring Wheat Sep 2015 582.75 +2.5 +0.43%
Spring Wheat Dec 2015 593 +2.75 +0.47%
Kansas City
Hard Red Wheat Mar 2015 546.5 +8 +1.49%
Hard Red Wheat May 2015 546.5 +5.75 +1.06%
Hard Red Wheat Jul 2015 550.5 +5.75 +1.06%
Hard Red Wheat Sep 2015 561.5 +5.75 +1.03%
Hard Red Wheat Dec 2015 577.5 +6.75 +1.18%


