Canola was flat to up slightly, with the stronger Canadian dollar, new-market jitters issues and a bit of what appeared to be wariness on the part of traders for the new trading tool based in New York, rather than Winnipeg. That, and the $500 per tonne barrier that appears to be in the way of the November contract’s growth. Canola finished at $493.80, up 20 cents. January and March were up 50 and 30 cents respectively, while May and July fell 20 and 60 cents. All remained above $500.
Soybeans were up on Chicago, reaching US$ 8.75 for August, rising 5-75 cents for both nearby months, 6-75 for November and 7 for January. Corn and all wheat markets caught the bug and rose as well, with Chicago wheat reaching a three-year high.
Read Also
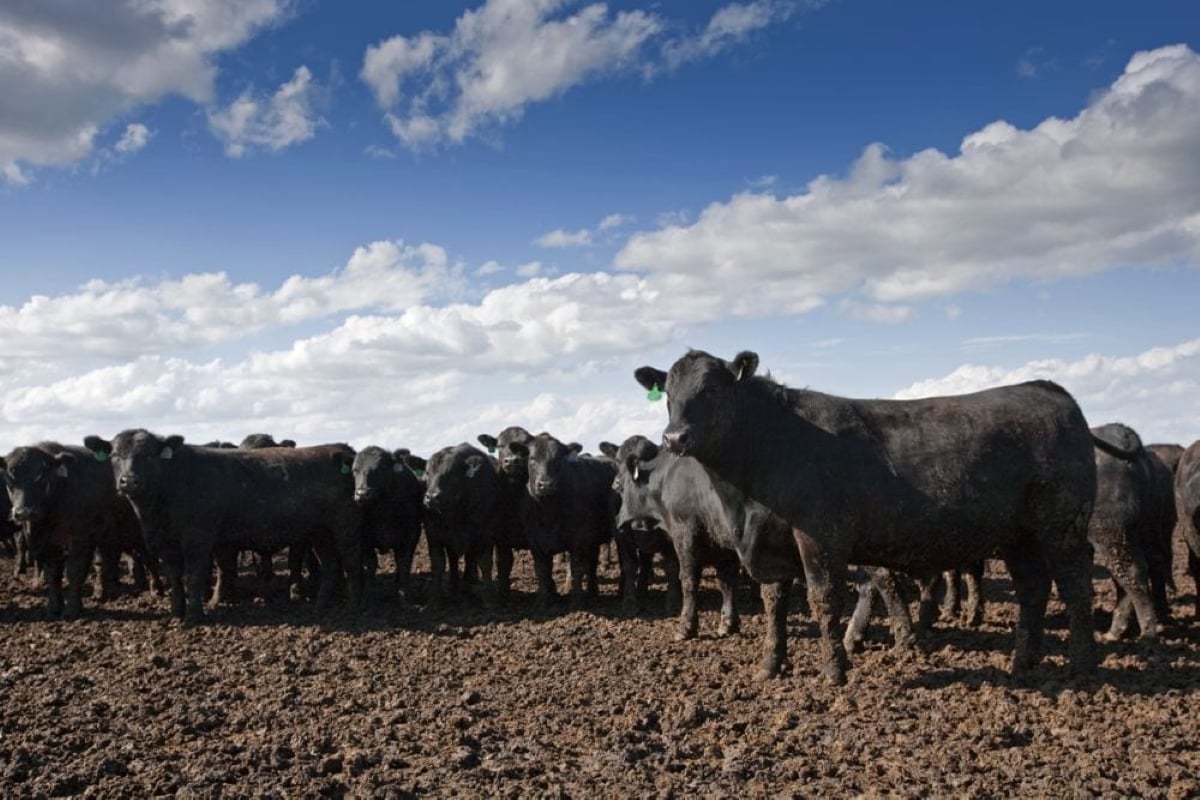
U.S. livestock: Cattle futures fall on expectations of US agriculture secretary announcement
Chicago | Reuters – Chicago Mercantile Exchange cattle futures fell on investor expectations that U.S. Agriculture Secretary Brooke Rollins might…
In Western Canada hard red spring jumped by as much as $18 per tonne, depending on the delivery point, according to PDQ pricing.
Black Sea wheat production is being pegged lower than earlier estimates and this is continuing to put upward price pressure on the crop. At the same time USDA crop condition reports are undercutting American crops. A huge global inventory of wheat remains, and that will keep a lid on any large, longer-term moves, say traders, however wheat optimism appears to be growing.
Sych Maryna a grain market analyst with UkrAgroConsult in the Ukraine suggested late last week that the country’s harvest, now half complete, is delivering reduced yields in cereals, up to 25 percent for barley, due to droughty conditions in May and June. Rain has impaired some harvest operations, however this is aiding corn development, and might even tip the country into a record production for the current crop.
| Name / Contract | High | Low | Last | Change | Settlement |
| Canola Nov 2018 (updated 1:18PM(CST) on 7/30/2018) | 496.00 | 490.20 | 493.80 | 0.20 | 493.80 |
| Canola Jan 2019 (updated 1:17PM(CST) on 7/30/2018) | 502.60 | 499.80 | 500.60 | 0.50 | 500.60 |
| Canola Mar 2019 (updated 11:18AM(CST) on 7/30/2018) | 507.30 | 504.80 | 505.80 | 0.30 | 505.80 |
| Canola May 2019 (updated 1:14PM(CST) on 7/30/2018) | 510.60 | 508.80 | 510.20 | -0.20 | 510.20 |
| Canola Jul 2019 (updated 1:14PM(CST) on 7/30/2018) | 512.60 | 511.80 | 512.20 | -0.60 | 512.20 |
| Soybeans Aug 2018 | 881.25 | 871.25 | 876.00 | 5.75 | 875.00 |
| Soybeans Sep 2018 | 886.25 | 876.00 | 881.50 | 5.75 | 880.75 |
| Soybeans Nov 2018 | 896.50 | 886.00 | 892.00 | 6.75 | 891.00 |
| Soybeans Jan 2019 | 905.50 | 896.25 | 902.50 | 7.00 | 901.50 |
| Soybeans Mar 2019 | 915.25 | 905.75 | 911.25 | 6.50 | 910.75 |
| Soybeans May 2019 | 924.50 | 915.00 | 920.50 | 6.50 | 920.00 |
| Soybean Meal Aug 2018 | 336.30 | 331.40 | 334.30 | 0.90 | 333.90 |
| Soybean Meal Sep 2018 | 335.70 | 330.90 | 333.50 | 0.90 | 332.90 |
| Soybean Meal Oct 2018 | 335.30 | 331.00 | 333.60 | 1.50 | 333.00 |
| Soybean Oil Aug 2018 | 28.66 | 28.25 | 28.38 | -0.11 | 28.31 |
| Soybean Oil Sep 2018 | 28.80 | 28.39 | 28.52 | -0.09 | 28.46 |
| Soybean Oil Oct 2018 | 28.85 | 28.51 | 28.64 | -0.07 | 28.58 |
| Corn Sep 2018 | 369.25 | 363.50 | 367.00 | 5.50 | 367.25 |
| Corn Dec 2018 | 383.25 | 377.50 | 381.00 | 5.25 | 381.25 |
| Corn Mar 2019 | 393.75 | 388.25 | 391.50 | 5.25 | 391.75 |
| Corn May 2019 | 399.25 | 394.00 | 397.25 | 5.75 | 397.25 |
| Corn Jul 2019 | 404.00 | 399.00 | 401.75 | 4.75 | 402.00 |
| Oats Sep 2018 | 236.50 | 232.00 | 233.50 | 1.25 | 232.75 |
| Oats Dec 2018 | 243.75 | 240.00 | 243.00 | 2.75 | 242.75 |
| Oats Mar 2019 | 247.25 | 247.25 | 247.25 | 3.50 | 247.25 |
| Oats May 2019 | 249.00 | 249.00 | 249.00 | 3.50 | 249.00 |
| Oats Jul 2019 | 252.50 | 252.50 | 252.50 | 3.25 | 252.50 |
| Wheat Sep 2018 | 551.75 | 532.75 | 545.00 | 14.75 | 546.50 |
| Wheat Dec 2018 | 571.25 | 552.50 | 564.75 | 15.25 | 566.50 |
| Wheat Mar 2019 | 586.25 | 568.25 | 580.00 | 14.75 | 581.75 |
| Wheat May 2019 | 591.50 | 574.50 | 585.25 | 13.50 | 587.50 |
| Wheat Jul 2019 | 592.00 | 573.75 | 585.75 | 13.00 | 587.50 |
| Spring Wheat Sep 2018 | 611.00 | 595.00 | 601.00 | 9.00 | 601.00 |
| Spring Wheat Dec 2018 | 624.00 | 609.25 | 615.50 | 10.00 | 615.50 |
| Spring Wheat Mar 2019 | 636.75 | 624.00 | 629.00 | 8.50 | 629.00 |
| Spring Wheat May 2019 | 643.00 | 634.25 | 635.50 | 7.00 | 635.50 |
| Spring Wheat Jul 2019 | 650.00 | 638.00 | 642.00 | 8.00 | 642.00 |
| Hard Red Wheat Sep 2018 | 553.00 | 535.25 | 546.50 | 14.25 | 547.75 |
| Hard Red Wheat Dec 2018 | 580.00 | 562.25 | 573.50 | 14.00 | 574.75 |
| Hard Red Wheat Mar 2019 | 596.75 | 579.50 | 590.25 | 13.75 | 591.50 |
| Hard Red Wheat May 2019 | 602.50 | 589.75 | 595.75 | 11.50 | 597.50 |
| Hard Red Wheat Jul 2019 | 602.75 | 587.50 | 596.25 | 11.00 | 598.00 |
| Live Cattle (P) Aug 2018 | 109.40 | 107.90 | 108.42 | -0.60 | 108.42 |
| Live Cattle (P) Oct 2018 | 111.12 | 109.18 | 109.80 | -1.00 | 109.80 |
| Live Cattle (P) Dec 2018 | 114.68 | 112.98 | 113.45 | -1.05 | 113.45 |
| Feeder Cattle (P) Aug 2018 | 152.88 | 151.08 | 151.50 | -1.00 | 151.50 |
| Feeder Cattle (P) Sep 2018 | 152.78 | 151.03 | 151.35 | -1.05 | 151.35 |
| Feeder Cattle (P) Oct 2018 | 153.25 | 151.45 | 151.78 | -1.17 | 151.78 |
| Lean Hogs (P) Aug 2018 | 64.02 | 63.20 | 63.30 | -0.38 | 63.30 |
| Lean Hogs (P) Oct 2018 | 51.95 | 50.58 | 51.22 | 0.22 | 51.22 |
| Lean Hogs (P) Dec 2018 | 47.28 | 45.82 | 46.60 | -0.05 | 46.60 |
| Canadian Dollar Aug 2018 | 0.7696 | 0.7649 | 0.7681 | 0.0025 | 0.7681 |
| Crude Sep 2018 | 70.43 | 68.80 | 70.00 | 0.96 | 70.13 |