By D’Arce McMillan, markets editor
Twitter @ darcemcmillan
Canola edged higher on Monday, throwing off the downward pressure found in today’s USDA report.
Crusher buying provided support to canola as did slow farmer selling.
Canola had been stronger early in trade, supported by stronger palm oil futures but when the USDA report came out, oilseeds fell.
Traders had expected a bullish report for soybeans with a reduction in year-end U.S. soybean stocks, reflecting the record pace of exports so far.
Read Also
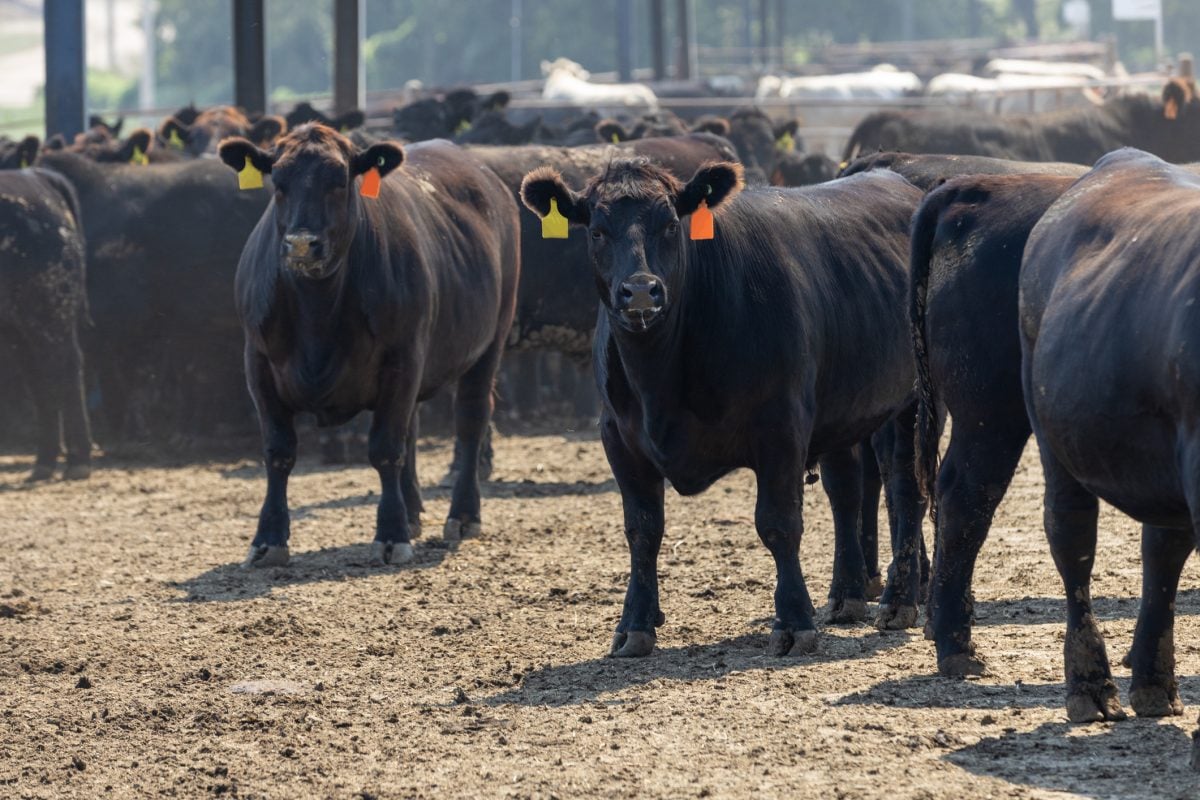
U.S. livestock: Feeder cattle hit contract highs on tight supply
Chicago | Reuters – All Chicago Mercantile Exchange feeder cattle futures and most live cattle futures hit contract highs on…
Instead, the USDA raised its estimate of the soybean harvest to 3.958 billion bushels, up from its October estimate of 3.927 billion.
USDA raised its domestic and export disappearance to keep ending stocks unchanged at 450 million bu., but the trade had expected a decrease.
Soybeans and soy meal futures fell. They closed lower, but canola battled back to settle in the black.
The trade expected a bearish report in corn but they got slightly bullish numbers.
USDA lowered its 2014 U.S. corn yield estimate to 173.4 bushels per acre from 174.2 in October, but still an all-time high.
U.S. corn ending stocks fell to 2.008 billion bu., from 2.081 billion last month.
The wheat numbers in the report overall were not bullish, but hard red spring wheat futures rallied a little on USDA’s trimming of the U.S. spring wheat crop and ending stocks.
Reuters reported that rains expected early this week in Argentina’s Pampas grains belt are expected to delay soy and corn planting, which had already been put behind schedule by heavier-than-normal showers last week, a local weather expert said.
The South American grains powerhouse is the world’s top exporter of soyoil and soymeal livestock feed. It is also a major supplier of corn and raw soybeans.
Argentine farmers have planted 7.2 percent of the 20.6 million hectares expected to be dedicated to soy in the 2014-15 season, according to the Buenos Aires Grains Exchange. Planting lags the last year by 3.5 percentage points, Reuters reported.
Seeding is also behind last year’s pace in Brazil, but thanks to recent rain, progress is improving.
As of Nov. 7 farmers had 46 perent of the soy crop in the ground, up from 29 percent the week before.
Planting is still behind last year’s pace of 59 percent and the five-year average of 61 percent.
The delay could reduce the size of the corn crop that is planted after soybeans are harvested.
The cold weather that spread across the Canadian Prairies funnelled south into the U.S. but it had little impact on crop futures even though it could interfere with late harvesting.
In a weekly crop progress report released after the CBOT close, the USDA said the U.S. corn harvest was 80 percent complete and soybeans were 90 percent harvested, roughly in line with trade expectations.
Winter wheat planting was 93 percent complete, and the USDA rated 60 percent of the crop as good to excellent, up from 59
percent the previous week.
Light crude oil nearby futures in New York dropped $1.25 at US$77.40 per barrel.
The Canadian dollar at noon was US88.14 cents, up from 88.03 cents the previous trading day. The U.S. dollar at noon was C$1.1345.
Winnipeg ICE Futures Canada dollars per tonne
Canola Nov 2014 452.60 +1.50 +0.33%
Canola Jan 2015 436.60 +1.50 +0.34%
Canola Mar 2015 435.30 +2.80 +0.65%
Canola May 2015 434.40 +3.20 +0.74%
Canola Jul 2015 434.30 +4.20 +0.98%
Milling Wheat Dec 2014 219.00 +4.00 +1.86%
Milling Wheat Mar 2015 226.00 +4.00 +1.80%
Milling Wheat May 2015 230.00 +4.00 +1.77%
Durum Wheat Dec 2014 356.50 unch 0.00%
Durum Wheat Mar 2015 357.50 unch 0.00%
Durum Wheat May 2015 357.50 unch 0.00%
Barley Dec 2014 155.00 +1.00 +0.65%
Barley Mar 2015 159.00 +1.00 +0.63%
Barley May 2015 159.00 +1.00 +0.63%
American crop prices in cents US/bushel, soybean meal in $US/short ton, soy oil in cents US/pound
Chicago
Soybeans Nov 2014 1027.5 -12.75 -1.23%
Soybeans Jan 2015 1025.75 -11 -1.06%
Soybeans Mar 2015 1030.25 -10 -0.96%
Soybeans May 2015 1034.75 -9.75 -0.93%
Soybeans Jul 2015 1039.25 -9 -0.86%
Soybeans Aug 2015 1039.75 -8.5 -0.81%
Soybean Meal Dec 2014 380.9 -9.5 -2.43%
Soybean Meal Jan 2015 364.7 -7 -1.88%
Soybean Meal Mar 2015 348.5 -5.7 -1.61%
Soybean Oil Dec 2014 32.36 -0.04 -0.12%
Soybean Oil Jan 2015 32.53 -0.06 -0.18%
Soybean Oil Mar 2015 32.75 -0.04 -0.12%
Corn Dec 2014 369.25 +1.75 +0.48%
Corn Mar 2015 382 +1.5 +0.39%
Corn May 2015 391 +1.5 +0.39%
Corn Jul 2015 398.25 +2 +0.50%
Corn Sep 2015 405.25 +2.25 +0.56%
Oats Dec 2014 336 -2.75 -0.81%
Oats Mar 2015 332.5 -0.25 -0.08%
Oats May 2015 332.5 +1 +0.30%
Oats Jul 2015 326.75 unch 0.00%
Oats Sep 2015 329.5 +0.5 +0.15%
Wheat Dec 2014 517.25 +2.75 +0.53%
Wheat Mar 2015 527.25 +1 +0.19%
Wheat May 2015 535 +1 +0.19%
Wheat Jul 2015 541.5 +1.25 +0.23%
Wheat Sep 2015 551 +1.75 +0.32%
Minneapolis
Spring Wheat Dec 2014 554.25 +8 +1.46%
Spring Wheat Mar 2015 567.25 +7 +1.25%
Spring Wheat May 2015 577.25 +7 +1.23%
Spring Wheat Jul 2015 587.25 +7 +1.21%
Spring Wheat Sep 2015 597 +7 +1.19%
Kansas City
Hard Red Wheat Dec 2014 573 +3.75 +0.66%
Hard Red Wheat Mar 2015 576.25 +2.25 +0.39%
Hard Red Wheat May 2015 580.5 +2.75 +0.48%
Hard Red Wheat Jul 2015 577.5 +4.75 +0.83%
Hard Red Wheat Sep 2015 589.5 +5 +0.86%