The USDA raised its forecasts for year end global stocks of corn, soybeans and wheat on Tuesday, adding to the gloom hanging over crop markets but futures prices hardly reacted.
Indeed, wheat futures rose more than one percent on short covering.
In canola, old crop futures rose while new crop fell and the spread between new and old crop widened, with May at a $15.30 premium to November.
May closed at $494.50, up $4.80 and November closed at $479.20, down $2.80.
The best basis in the par region of central Saskatchewan remained at zero, according to ICE Futures Canada.
Read Also
Louis Dreyfus posts higher volumes, lower profits in first half
Agricultural commodity merchant Louis Dreyfus Company recorded a rise in first-half sales, supported by higher volumes shipped, but weaker prices for most crops pushed down profits, it said on Friday.
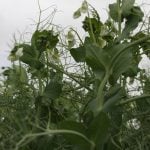
Rain and flurries are expected in central and northern parts of the Prairie grain belt beginning Thursday and continuing until Saturday, with Saturday looking chilly with highs only at the freezing mark.
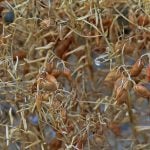
PAKISTAN LENTIL IMPORTS
A Pakistan trade association has asked its pulse suppliers in Canada and Australia to slow shipments because domestic prices have crashed and buyers might be forced to default.
There is also an issue regarding fumigation.
Pakistani newspapers report that the country’s department of plant protection in mid March stopped about 400 containers of imported pulses for fumigation.
Importers criticized the move, saying they were being blackmailed ahead of the Muslim holy month of Ramadan. Although Muslims fast during the day during the holiday period, they eat festive meals at night. Ramadan begins May 26 this year.
In 2016, Pakistan was Canada’s sixth largest customer for lentils, taking about 6.4 percent of all exports.
USDA
The USDA made only minor changes to its domestic supply and demand numbers but added to its forecasts for world year end stocks.
| Global ending stocks | 2015-16 USDA | March 2016-17 USDA | April 2016-17 USDA | Trade f’cast |
| Corn | 221.83 | 220.68 | 222.98 | 221.81 |
| Soy | 77.13 | 82.82 | 87.41 | 83.91 |
| Wheat | 241.74 | 249.94 | 252.26 | 250.24 |
It raised its forecast for Brazil’s soybean crop to 110 million tonnes from 108 million last month and 96.5 million last year.
It raised its Argentina forecast by 500,000 tonnes to 56 million, still a little smaller than last year’s 56.8 million.
It also raised Paraguay’s soy crop to 10.1 million tonnes, up from 9.17 million.
The world soybean production forecast increased to 345.97 million tonnes, up about five million.
In corn it raised Brazil’s crop two million tonnes from last month to 93.5 million. It raised Argentina’s corn crop one million tonnes to 38.5 million.
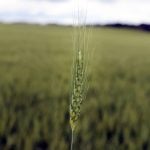
There were no major changes to world wheat production but USDA trimmed its feed demand outlook, resulting in the slightly higher year-end global stocks.
CHINA VEG OIL SURPLUS
Reuters reports that strong soybean crush to meet meal demand has led to a surplus of soy oil in China. Also, the government has been auctioning off old stocks of domestic rapeseed oil.
OUTSIDE MARKETS
Light crude oil nearby futures in New York were up 32 cents to US$53.40 per barrel.
In the afternoon, the Canadian dollar was trading around US74.99 cents, down slightly from 75.01 cents the previous trading day. The U.S. dollar was C$1.3335.
The Dow Jones Industrial Average fell 6.65 points, or 0.03 percent, to 20,651.37, the S&P 500 lost 3.37 points, or 0.14 percent, to 2,353.79 and the Nasdaq Composite dropped 14.15 points, or 0.24 percent, to 5,866.77.
The Toronto Stock Exchange’s S&P/TSX composite index closed down 3.68 points, or 0.02 percent, at 15,727.11.
Winnipeg ICE Futures Canada dollars per tonne
Canola May 2017 494.50 +4.80 +0.98%
Canola Jul 2017 494.80 +2.60 +0.53%
Canola Nov 2017 479.20 -2.80 -0.58%
Canola Jan 2018 481.60 -2.70 -0.56%
Canola Mar 2018 483.90 -2.80 -0.58%
Milling Wheat May 2017 226.00 +1.00 +0.44%
Milling Wheat Jul 2017 227.00 +1.00 +0.44%
Milling Wheat Oct 2017 223.00 unch 0.00%
Durum Wheat May 2017 272.00 -1.00 -0.37%
Durum Wheat Jul 2017 271.00 -1.00 -0.37%
Durum Wheat Oct 2017 263.00 -1.00 -0.38%
Barley May 2017 137.00 unch 0.00%
Barley Jul 2017 138.00 unch 0.00%
Barley Oct 2017 140.00 unch 0.00%
American crop prices in cents US/bushel, soybean meal in $US/short ton, soy oil in cents US/pound
Chicago
Soybeans May 2017 939.25 -2.50 -0.27%
Soybeans Jul 2017 950.75 -2.50 -0.26%
Soybeans Aug 2017 952.75 -2.25 -0.24%
Soybeans Sep 2017 950.00 -2.25 -0.24%
Soybeans Nov 2017 948.50 -1.25 -0.13%
Soybeans Jan 2018 954.75 -1.25 -0.13%
Soybean Meal May 2017 309.30 +0.20 +0.06%
Soybean Meal Jul 2017 313.50 +0.30 +0.10%
Soybean Meal Aug 2017 314.40 +0.40 +0.13%
Soybean Oil May 2017 31.07 -0.28 -0.89%
Soybean Oil Jul 2017 31.31 -0.31 -0.98%
Soybean Oil Aug 2017 31.42 -0.31 -0.98%
Corn May 2017 366.50 -0.50 -0.14%
Corn Jul 2017 373.75 -0.75 -0.20%
Corn Sep 2017 380.75 -1.00 -0.26%
Corn Dec 2017 390.50 -0.50 -0.13%
Corn Mar 2018 399.25 -0.25 -0.06%
Oats May 2017 219.75 +3.25 +1.50%
Oats Jul 2017 219.50 +3.50 +1.62%
Oats Sep 2017 217.25 +3.25 +1.52%
Oats Dec 2017 218.00 +2.75 +1.28%
Oats Mar 2018 226.50 +4.25 +1.91%
Wheat May 2017 433.25 +4.50 +1.05%
Wheat Jul 2017 447.50 +5.75 +1.30%
Wheat Sep 2017 461.00 +6.00 +1.32%
Wheat Dec 2017 481.00 +6.25 +1.32%
Wheat Mar 2018 497.25 +6.25 +1.27%
Minneapolis
Spring Wheat May 2017 527.75 +8.50 +1.64%
Spring Wheat Jul 2017 535.50 +8.50 +1.61%
Spring Wheat Sep 2017 543.50 +8.00 +1.49%
Spring Wheat Dec 2017 554.75 +8.00 +1.46%
Spring Wheat Mar 2018 565.50 +7.75 +1.39%
Kansas City
Hard Red Wheat May 2017 429.75 +4.25 +1.00%
Hard Red Wheat Jul 2017 442.00 +3.75 +0.86%
Hard Red Wheat Sep 2017 457.75 +4.50 +0.99%
Hard Red Wheat Dec 2017 482.00 +4.25 +0.89%
Hard Red Wheat Mar 2018 499.00 +4.00 +0.81%
Chicago livestock futures in US¢/pound (rounded to two decimal places)
Live Cattle (P) Apr 2017 123.25 +2.15 +1.78%
Live Cattle (P) Jun 2017 113.70 +1.40 +1.25%
Live Cattle (P) Aug 2017 109.85 +1.25 +1.15%
Feeder Cattle (P) Apr 2017 137.18 +1.88 +1.39%
Feeder Cattle (P) May 2017 137.32 +1.94 +1.43%
Feeder Cattle (P) Aug 2017 139.18 +2.01 +1.47%
Lean Hogs (P) Apr 2017 62.65 -0.68 -1.07%
Lean Hogs (P) May 2017 69.58 +0.23 +0.33%
Lean Hogs (P) Jun 2017 74.00 +0.72 +0.98%