By D’Arce McMijllan, markets editor
Twitter @ darcemcmillan
Canola and other crop futures fell Wednesday as the U.S. harvest approaches its conclusion and more supplies hit the cash market.
Soybeans, meal and oil all fell, with the down swell washing into the canola market, which had risen the previous three sessions.
There was added technical weakness as the price in various contracts fell below key moving averages.
Analysts expect the U.S. Department of Agriculture tomorrow will show that soybean export sales were in a range from 700,000 to one million tonnes in the latest week. A week ago, soy export sales were 1.074 million tonnes.
Soymeal export sales are expected to be between a negative 100,000 to 100,000 tonnes compared to 21,337 tonnes a week ago.
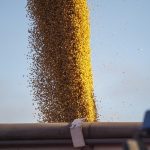
Corn was pressured lower by the advancing harvest and larger available cash supplies.
That helped to pressure wheat lower.
Crop forecaster Lanworth issued an outlook of the U.S. winter wheat seeded area and production. See the story here.
Read Also
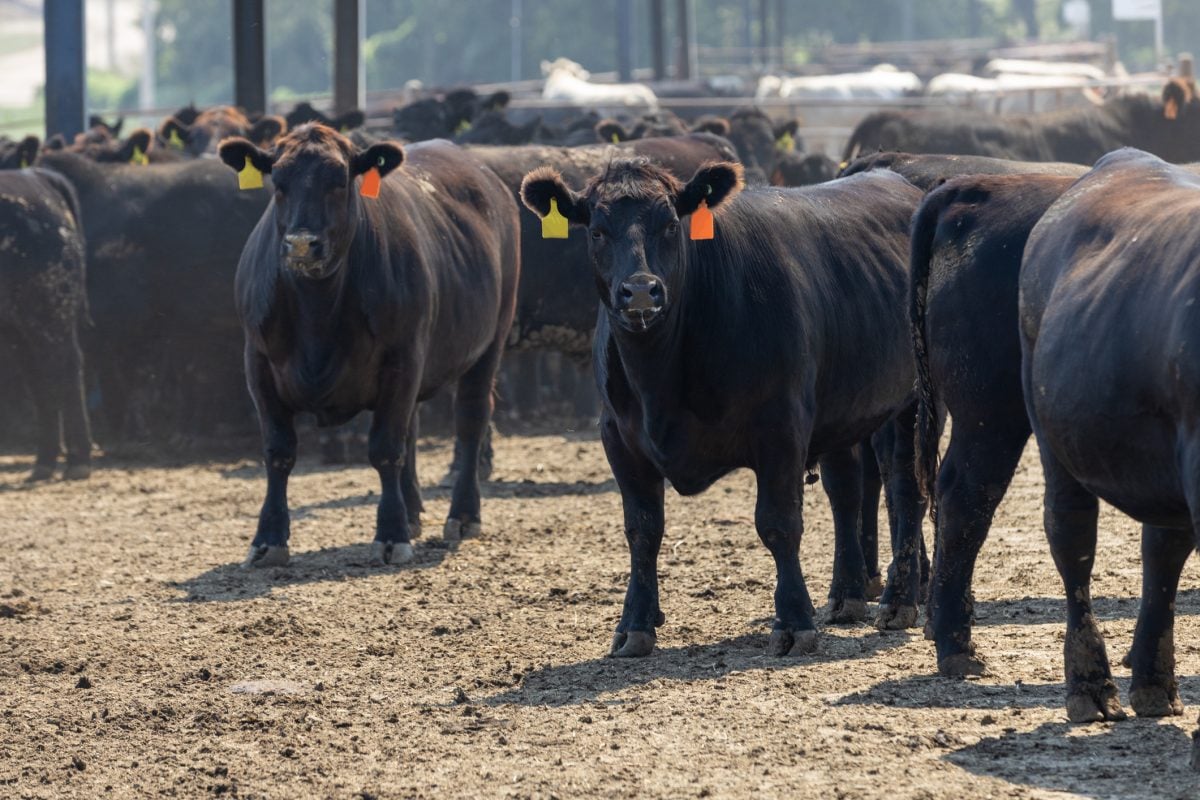
U.S. livestock: Feeder cattle hit contract highs on tight supply
Chicago | Reuters – All Chicago Mercantile Exchange feeder cattle futures and most live cattle futures hit contract highs on…
Light crude oil nearby futures in New York dropped three cents at US$74.58 per barrel.
The Canadian dollar at noon was US88.11 cents, down from US88.46 cents the previous trading day. The U.S. dollar at noon was C$1.1350.
Minutes of the U.S. central bank’s Oct. 28-29 meeting, where policymakers decided to finally end their bond-buying stimulus, indicated a debate among policymakers over the outlook for inflation and the economy. It gave traders few clues as to when interest rate might rise.
The Toronto Stock Exchange’s S&P/TSX composite index closed up 7.18 points, or 0.05 percent, at 14,980.15.
The Dow Jones industrial average fell 2.09 points, or 0.01 percent, to 17,685.73, the S&P 500 lost 3.08 points, or 0.15 percent, to 2,048.72 and the Nasdaq Composite dropped 26.73 points, or 0.57 percent, to 4,675.71.
WATCH FOR MY VIDEO WEEKLY MARKET WRAPUP THURSDAY MORNING AT PRODUCER.COM.
Winnipeg ICE Futures Canada dollars per tonne
Canola Jan 2015 427.90 -5.50 -1.27%
Canola Mar 2015 431.40 -5.00 -1.15%
Canola May 2015 432.70 -4.70 -1.07%
Canola Jul 2015 433.70 -5.20 -1.18%
Canola Nov 2015 430.10 -7.10 -1.62%
Milling Wheat Dec 2014 222.00 -3.00 -1.33%
Milling Wheat Mar 2015 230.00 -3.00 -1.29%
Milling Wheat May 2015 233.00 -3.00 -1.27%
Durum Wheat Dec 2014 356.50 unch 0.00%
Durum Wheat Mar 2015 357.50 unch 0.00%
Durum Wheat May 2015 357.50 unch 0.00%
Barley Dec 2014 160.00 unch 0.00%
Barley Mar 2015 163.00 unch 0.00%
Barley May 2015 163.00 unch 0.00%
American crop prices in cents US/bushel, soybean meal in $US/short ton, soy oil in cents US/pound
Chicago
Soybeans Jan 2015 1004.75 -18.5 -1.81%
Soybeans Mar 2015 1012 -19 -1.84%
Soybeans May 2015 1018.25 -19 -1.83%
Soybeans Jul 2015 1023.25 -19.25 -1.85%
Soybeans Aug 2015 1024.25 -18.5 -1.77%
Soybeans Sep 2015 1005.75 -18 -1.76%
Soybean Meal Dec 2014 370.4 -7.6 -2.01%
Soybean Meal Jan 2015 356.1 -7.5 -2.06%
Soybean Meal Mar 2015 340.7 -7.7 -2.21%
Soybean Oil Dec 2014 32.51 -0.14 -0.43%
Soybean Oil Jan 2015 32.64 -0.15 -0.46%
Soybean Oil Mar 2015 32.86 -0.16 -0.48%
Corn Dec 2014 363.25 -8.75 -2.35%
Corn Mar 2015 376 -9 -2.34%
Corn May 2015 385 -8.75 -2.22%
Corn Jul 2015 392.25 -8.75 -2.18%
Corn Sep 2015 398 -9.25 -2.27%
Oats Dec 2014 326.5 -7.5 -2.25%
Oats Mar 2015 330.25 -2.75 -0.83%
Oats May 2015 329 -1.75 -0.53%
Oats Jul 2015 326 -2.25 -0.69%
Oats Sep 2015 321.75 -7.5 -2.28%
Wheat Dec 2014 537.75 -11.25 -2.05%
Wheat Mar 2015 541 -10 -1.81%
Wheat May 2015 547.25 -10.5 -1.88%
Wheat Jul 2015 553.5 -10.5 -1.86%
Wheat Sep 2015 562.25 -10.75 -1.88%
Minneapolis
Spring Wheat Dec 2014 571.5 -7 -1.21%
Spring Wheat Mar 2015 578 -8.75 -1.49%
Spring Wheat May 2015 586.5 -8.75 -1.47%
Spring Wheat Jul 2015 594.5 -8.75 -1.45%
Spring Wheat Sep 2015 602.75 -9 -1.47%
Kansas City
Hard Red Wheat Dec 2014 586.25 -7.25 -1.22%
Hard Red Wheat Mar 2015 589.25 -7.25 -1.22%
Hard Red Wheat May 2015 591.75 -8.25 -1.38%
Hard Red Wheat Jul 2015 592.5 -8 -1.33%
Hard Red Wheat Sep 2015 603.75 -8.25 -1.35%