Canola had a good day Monday, making back some of the territory lost in the recent rout.
But the bounce back doesn’t mean much has really changed, according to one trader.
“It got overdone,” said Ken Ball of P.I. Financial in Winnipeg about the Monday recovery.
Much short-covering was probably involved in Monday’s movements, he thinks, plus spread traders playing in the easy-to-move canola futures market.
“It has very little to do with canola itself. It’s just traders maneuvering their positions,” said Ball.
Read Also

Farm cash receipts rise in first half of 2025 on livestock gains
Farm cash receipts in the first half of the year were up 3.3 per cent over the same period last year buoyed by livestock receipts. Overall receipts between January and June totalled $49.6 billion, up $1.6 billion from the same period last year, Statistics Canada reported.
Canola rose $4.90 per tonne, or over 10 cents per bushel, to $455.20 on the March contract. The May contract closed at $457.20, also up $4.90 or one percent.
Soybean oil rose 0.72 percent, and soybeans and soybean meal moved little. Corn was almost flat, and wheat rose only weakly with lingering support from concern about dry weather in the U.S. southern Plains.
Corn has been fairly weak and flat all 2016, with large stockpiles and expectations of healthy spring acreage.
Soybeans were supported by investors lightening short positions and with crude oil rising and making the vegetable oil content of soybeans more valuable.
Canola’s heavy oil content also allowed it to gain from the surge in crude. West Texas Intermediate rose over five percent to $37-$41 in nearby contracts.
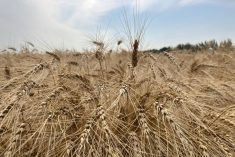
Good news for the Canadian crop marketing outlook came from reports of heavy rains in India hurting winter wheat, canola and chickpeas. Last year harvest rains did much damage and disruption to Indian crops, helping create the import demand that so many prairie pulse farmers benefitted from this winter.
The impact of these rains and hail is hard to assess today, but substantial damage would likely lead to significant imports.
Light crude oil nearby futures in New York were up $1.98 to US$37.90 per barrel.
The Canadian dollar at noon was US75.18 cents, up from 74.98 cents the previous trading day. The U.S. dollar at noon was C$1.3301.
Winnipeg ICE Futures Canada dollars per tonne
Canola Mar 2016 455.20 +4.90 +1.09%
Canola May 2016 457.20 +4.90 +1.08%
Canola Jul 2016 462.40 +4.90 +1.07%
Canola Nov 2016 470.20 +4.00 +0.86%
Canola Jan 2017 475.00 +4.00 +0.85%
Milling Wheat Mar 2016 225.00 +1.00 +0.45%
Milling Wheat May 2016 228.00 +1.00 +0.44%
Milling Wheat Jul 2016 231.00 +1.00 +0.43%
Durum Wheat Mar 2016 288.00 -6.00 -2.04%
Durum Wheat May 2016 293.00 -6.00 -2.01%
Durum Wheat Jul 2016 281.00 -5.00 -1.75%
Barley Mar 2016 174.00 unch 0.00%
Barley Jul 2016 176.00 unch 0.00%
American crop prices in cents US/bushel, soybean meal in $US/short ton, soy oil in cents US/pound
Chicago
Soybeans Mar 2016 873.5 +3 +0.34%
Soybeans May 2016 881.75 +3.25 +0.37%
Soybeans Jul 2016 887.25 +2.75 +0.31%
Soybeans Aug 2016 889.5 +2.75 +0.31%
Soybeans Sep 2016 889.5 +2.5 +0.28%
Soybeans Nov 2016 893 +2 +0.22%
Soybean Meal Mar 2016 268.5 +0.8 +0.30%
Soybean Meal May 2016 271.1 +0.2 +0.07%
Soybean Meal Jul 2016 273.6 +0.4 +0.15%
Soybean Oil Mar 2016 30.95 +0.22 +0.72%
Soybean Oil May 2016 31.17 +0.21 +0.68%
Soybean Oil Jul 2016 31.41 +0.22 +0.71%
Corn Mar 2016 355 +0.5 +0.14%
Corn May 2016 359 +0.75 +0.21%
Corn Jul 2016 364.75 +1.25 +0.34%
Corn Sep 2016 370.5 +1 +0.27%
Corn Dec 2016 379.5 +1.5 +0.40%
Oats Mar 2016 176.25 +6 +3.52%
Oats May 2016 187.75 +6 +3.30%
Oats Jul 2016 197.75 +5.5 +2.86%
Oats Sep 2016 203.25 +4.25 +2.14%
Oats Dec 2016 212.75 +4.25 +2.04%
Wheat Mar 2016 457.75 +3 +0.66%
Wheat May 2016 462.75 +2 +0.43%
Wheat Jul 2016 469 +2.25 +0.48%
Wheat Sep 2016 478.75 +2.5 +0.52%
Wheat Dec 2016 493.25 +2 +0.41%
Minneapolis
Spring Wheat Mar 2016 506 +3.25 +0.65%
Spring Wheat May 2016 500.75 +3 +0.60%
Spring Wheat Jul 2016 508.75 +3.25 +0.64%
Spring Wheat Sep 2016 518.5 +3.75 +0.73%
Spring Wheat Dec 2016 533.25 +2.75 +0.52%
Kansas City
Hard Red Wheat Mar 2016 459.75 +2 +0.44%
Hard Red Wheat May 2016 470.75 +2 +0.43%
Hard Red Wheat Jul 2016 480.25 +2.25 +0.47%
Hard Red Wheat Sep 2016 493.5 +2 +0.41%
Hard Red Wheat Dec 2016 513.5 +2.75 +0.54%