
Canola rose Wednesday, supported by rising soybeans and crude oil.
Tight old crop oilseed stocks in North American and bargain hunting continue to support canola and soybeans.
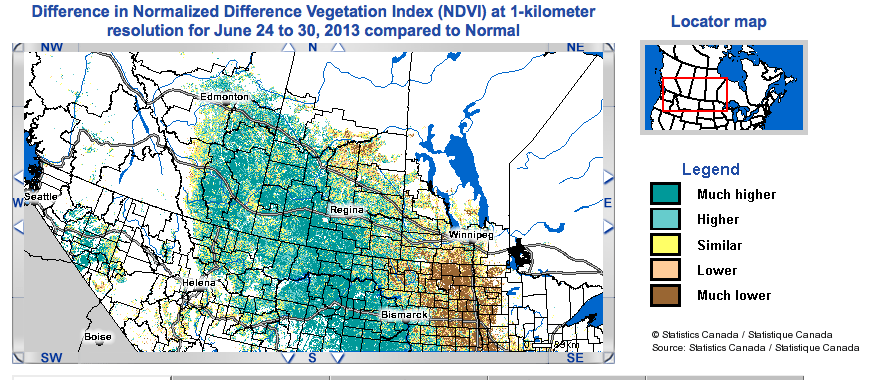
Gains were limited by generally favourable crop conditions. See the accompanying vegetation index map from Statistics Canada. It shows crops are fairing better than normal in large parts of Alberta and Saskatchewan, but are normal to below normal in Manitoba and eastern North Dakota.
 Louis Dreyfus in Yorkton posted a July delivery canola basis of +$72 per tonne over the November futures for a net price of $611.10 or $13.86.
Read Also

U.S. grains: Soy futures set 15-month high after China agrees to purchases
U.S. soybean futures reached a 15-month high on Thursday after President Donald Trump’s administration said top-importer China agreed to buy tens of millions of tons of American crops in the next few years as part of a trade truce.
September delivery basis was -$20 under the November contract for a net price of $519.10 or $11.77.
Wheat futures rose on news that China has bought large amounts of U.S. and Australian wheat this week. Rain at harvest hurt the quality of China’s winter wheat crop, affecting about eight percent of domestic production. Analysts think this will cause the Asian giant to import more than the 3.5 million tonnes that the USDA forecasts for 2013-14.
The USDA attaché in Beijing today pegged China’s wheat crop at 118 million tonnes. The USDA official forecast is 121 million. The attaché put imports at four million tonnes.
USDA will update its world supply and demand outlook July 11.
Two private forecasters today raised their estimates of U.S. corn and soybean production, as the forecast for the first half of July shows the Midwest will avoid extreme heat.
Lanworth raised its forecast for U.S. 2013 soybean crop to 3.36 billion bushels from its previous 3.34 billion forecast.
Informa Economics today pegged the soybean crop at 3.376 billion bu., up from 3.366 billion.
For corn, Lanworth raised its estimate to a record 13.9 billion bu. from its previous outlook for 13.7 billion.
Informa Economics’ raised its estimate to 14.259 billion bu., up from it’s previous forecast for 14.078 billion.
Informa lowered its forecast of U.S. winter wheat production to 1.476 billion bu., from 1.509 billion previously.
By class, it put hard red winter wheat at 730 million bu., below the USDA’s last estimate of 781 million.
Soft red winter wheat was 532 million bu., above the USDA’s forecast of 509 million.
Spring wheat other than durum was put at 482 million bu., from 483 million previously.
Winnipeg ICE Futures Canada dollars per tonne
Canola Jul 2013 610.60 +10.30 +1.72%
Canola Nov 2013 539.10 +2.20 +0.41%
Canola Jan 2014 544.00 +2.10 +0.39%
Canola Mar 2014 545.80 +0.50 +0.09%
Canola May 2014 545.30 +0.10 +0.02%
Milling Wheat Jul 2013 294.00 unch 0.00%
Milling Wheat Oct 2013 294.00 unch 0.00%
Milling Wheat Dec 2013 294.00 unch 0.00%
Durum Wheat Jul 2013 301.90 unch 0.00%
Durum Wheat Oct 2013 294.90 unch 0.00%
Durum Wheat Dec 2013 299.40 unch 0.00%
Barley Jul 2013 244.00 unch 0.00%
Barley Oct 2013 194.00 unch 0.00%
Barley Dec 2013 199.00 unch 0.00%
American crop prices in cents US/bushel, soybean meal in $US/short ton, soy oil in cents US/pound
Chicago
Soybeans Jul 2013 1583.5 +10.5 +0.67%
Soybeans Aug 2013 1441.25 +7.75 +0.54%
Soybeans Sep 2013 1297.5 +3.75 +0.29%
Soybeans Nov 2013 1250.75 +8.25 +0.66%
Soybeans Jan 2014 1256.5 +8 +0.64%
Soybeans Mar 2014 1258.75 +8.5 +0.68%
Soybean Meal Jul 2013 490.6 +3.6 +0.74%
Soybean Meal Aug 2013 432.6 -0.3 -0.07%
Soybean Meal Sep 2013 395.8 +0.5 +0.13%
Soybean Oil Jul 2013 47.22 +0.3 +0.64%
Soybean Oil Aug 2013 47.11 +0.28 +0.60%
Soybean Oil Sep 2013 46.68 +0.28 +0.60%
Corn Jul 2013 678.25 +5.5 +0.82%
Corn Sep 2013 532.25 -0.75 -0.14%
Corn Dec 2013 502.75 unch 0.00%
Corn Mar 2014 514.75 unch 0.00%
Corn May 2014 522.5 unch 0.00%
Oats Jul 2013 392 +1.75 +0.45%
Oats Sep 2013 359 +7.75 +2.21%
Oats Dec 2013 341.75 +6.5 +1.94%
Oats Mar 2014 347.25 +6 +1.76%
Oats May 2014 352.75 +9.25 +2.69%
Wheat Jul 2013 657.75 +8.25 +1.27%
Wheat Sep 2013 665 +6.75 +1.03%
Wheat Dec 2013 677.5 +6.25 +0.93%
Wheat Mar 2014 691.5 +6.5 +0.95%
Wheat May 2014 697.25 +3 +0.43%
Minneapolis
Spring Wheat Jul 2013 761.25 +4.25 0.56%
Spring Wheat Sep 2013 770.25 -0.5 -0.06%
Spring Wheat Dec 2013 779.75 -unch 0.00%
Spring Wheat Mar 2014 795.75 +1.00 +0.13%
Spring Wheat May 2014 804.25 +1.5 +0.19%
Kansas City
KCBT Red Wheat Jul 2013 683.5 +9.5 +1.41%
KCBT Red Wheat Sep 2013 694.5 +3.75 +0.54%
KCBT Red Wheat Dec 2013 716.25 +4 +0.56%
KCBT Red Wheat Mar 2014 730 +3.5 +0.48%
KCBT Red Wheat May 2014 736.75 +2.75 +0.37%
Light crude oil nearby futures in New York rose $1.64 at $101.24 US per barrel on the sharp decline in crude stockpiles in the United States and political unrest in Egypt.
The Canadian dollar at noon was 95.03 cents US, up from 94.97 cents the previous trading day. The U.S. dollar at noon was $1.0523 Cdn.
There was mixed data on the health of the U.S. economy, China services sector in June expanded only modestly and Portuguese 10-year bond yield topped eight percent over the potential for a snap election in that EU country.
In early tallies —
The Toronto Stock Exchange’s S&P/TSX composite index fell 32.70 points, or 0.27 percent, at 12,145.68.
The Dow Jones industrial average rose 56.14 points or 0.38 percent, to end at 14,988.55.
The S&P 500 gained 1.33 points or 0.08 percent, to finish at 1,615.41.
The Nasdaq Composite added 10.27 points or 0.30 percent, to close at 3,443.67.


