New crop canola futures drifted lower on Monday, weighed down by a rising Canadian dollar.
Trade was light as the U.S. market was closed for the Independence Day holiday.
The loonie gained about one cent.
A number of regions in all three Prairie provinces got rain over the holiday weekend.
In the U.S. rain fell in Kansas, Missouri and southern Illinois, but mostly missed dry areas of Iowa, the largest corn producing state.
However, more rain is forecast for almost all the Midwest later this week, although accumulations in Iowa will likely continue to be light.
Read Also

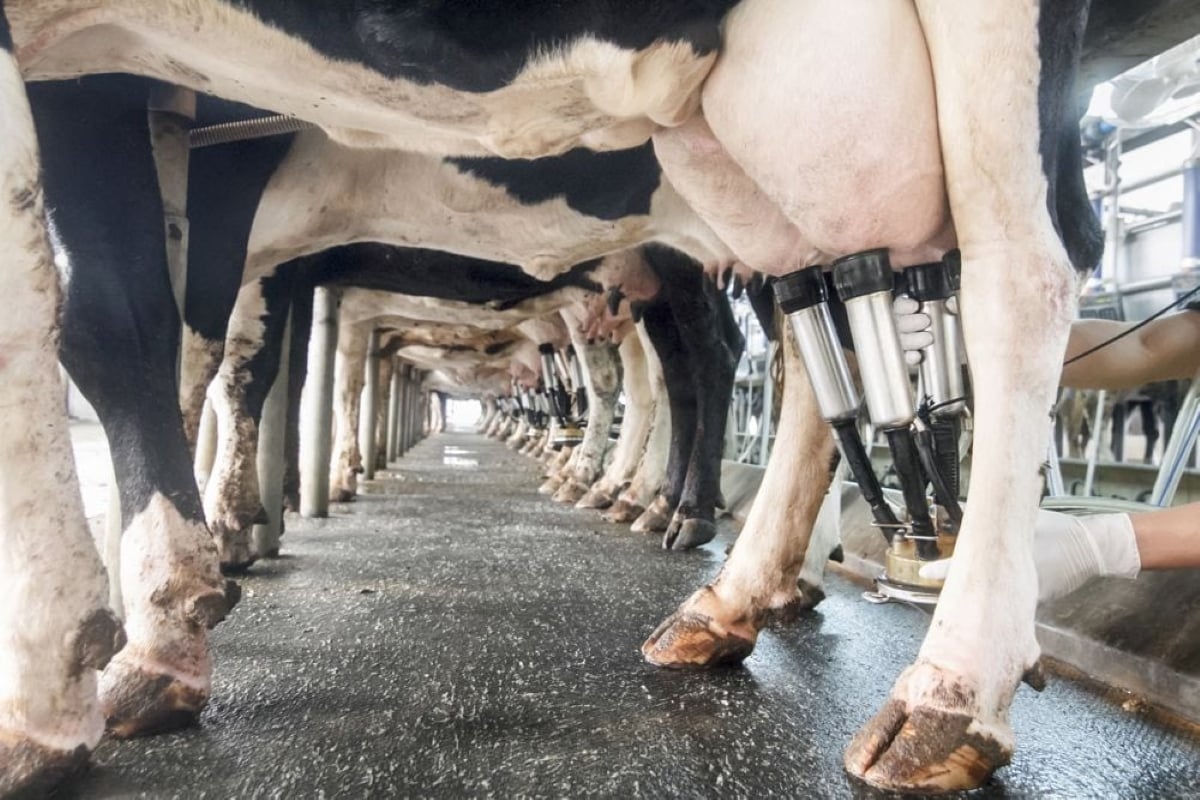
Farm gate milk price to rise in 2026
The Canadian Dairy Commission will raise its farm gate milk price by 2.3255 per cent in February, the Crown corporation announced on Friday.
The holiday Monday in the U.S. will delay the weekly crop condition reports until Tuesday.
Rain is affecting the quality of the wheat crop in France and Russia, although yields are expected to be strong.
And Ukraine is now expected to harvest a similar amount of grain as last year, despite problems last fall when the winter crop was seeded.
Light crude oil nearby futures in New York on Friday were up 66 cents to US$48.99 per barrel.
The Canadian dollar at noon today was US77.86 cents, up from 76.87 cents the previous trading day. The U.S. dollar at noon was C$1.2844.
The Toronto Stock Exchange’s S&P/TSX composite index closed up 194.33 points, or 1.38 percent, at 14,258.87, lifted by silver and gold mining stocks.
Winnipeg ICE Futures Canada dollars per tonne
Canola Jul 2016 487.40 +1.90 +0.39%
Canola Nov 2016 493.60 -2.10 -0.42%
Canola Jan 2017 501.30 -1.90 -0.38%
Canola Mar 2017 506.80 -2.10 -0.41%
Canola May 2017 510.80 -2.10 -0.41%
Milling Wheat Oct 2016 214.00 unch 0.00%
Milling Wheat Dec 2016 218.00 unch 0.00%
Durum Wheat Oct 2016 286.00 unch 0.00%
Durum Wheat Dec 2016 288.00 unch 0.00%
Barley Oct 2016 171.50 unch 0.00%
Barley Dec 2016 171.50 unch 0.00%
American crop prices in cents US/bushel, soybean meal in $US/short ton, soy oil in cents US/pound
Chicago
Soybeans Jul 2016 1168.75 unch 0.00%
Soybeans Aug 2016 1164.25 unch 0.00%
Soybeans Sep 2016 1148.75 unch 0.00%
Soybeans Nov 2016 1137.50 unch 0.00%
Soybeans Jan 2017 1133.00 unch 0.00%
Soybeans Mar 2017 1094.25 unch 0.00%
Soybean Meal Jul 2016 404.80 unch 0.00%
Soybean Meal Aug 2016 404.20 unch 0.00%
Soybean Meal Sep 2016 401.00 unch 0.00%
Soybean Oil Jul 2016 31.03 unch 0.00%
Soybean Oil Aug 2016 31.18 unch 0.00%
Soybean Oil Sep 2016 31.30 unch 0.00%
Corn Jul 2016 353.00 unch 0.00%
Corn Sep 2016 360.00 unch 0.00%
Corn Dec 2016 367.00 unch 0.00%
Corn Mar 2017 376.00 unch 0.00%
Corn May 2017 381.25 unch 0.00%
Oats Jul 2016 205.50 unch 0.00%
Oats Sep 2016 191.25 unch 0.00%
Oats Dec 2016 192.75 unch 0.00%
Oats Mar 2017 205.25 unch 0.00%
Oats May 2017 209.75 unch 0.00%
Wheat Jul 2016 416.25 unch 0.00%
Wheat Sep 2016 430.25 unch 0.00%
Wheat Dec 2016 450.75 unch 0.00%
Wheat Mar 2017 468.75 unch 0.00%
Wheat May 2017 480.25 unch 0.00%
Minneapolis
Spring Wheat Jul 2016 489.25 unch 0.00%
Spring Wheat Sep 2016 500.00 unch 0.00%
Spring Wheat Dec 2016 516.00 unch 0.00%
Spring Wheat Mar 2017 531.00 unch 0.00%
Spring Wheat May 2017 540.50 unch 0.00%
Kansas City
Hard Red Wheat Jul 2016 394.25 unch 0.00%
Hard Red Wheat Sep 2016 411.50 unch 0.00%
Hard Red Wheat Dec 2016 436.25 unch 0.00%
Hard Red Wheat Mar 2017 452.75 unch 0.00%
Hard Red Wheat May 2017 463.50 unch 0.00%
Chicago livestock futures in US¢/pound
Live Cattle (P) Aug 2016 112.98 +0.01 +0.01%
Live Cattle (P) Oct 2016 113.28 unch 0.00%
Live Cattle (P) Dec 2016 113.78 unch 0.00%
Feeder Cattle (P) Aug 2016 142.45 unch 0.00%
Feeder Cattle (P) Sep 2016 141.70 unch 0.00%
Feeder Cattle (P) Oct 2016 140.55 unch 0.00%
Lean Hogs (P) Jul 2016 82.68 +0.01 +0.01%
Lean Hogs (P) Aug 2016 83.95 unch 0.00%
Lean Hogs (P) Oct 2016 72.35 unch 0.00%


