The spring wheat market shifted from deeply concerned to panic Thursday and old crop canola saw a nice gain.
Most-traded September Minneapolis wheat closed up 4.45 percent at US$7.39 ½. Earlier in the day it traded as high as $7.68.
In Canada PDQInfo.ca said No. 1 CWRS 13.5 percent protein cash ranged C$8.08-$8.23 per bushel in Saskatchewan, $8.35-$8.43 in Alberta and $8.05-$8.46 in Manitoba.
Expectations of a heatwave next week in the Northern Plains and in western Canada, added to the worries about lack of moisture.
Read Also

U.S. grains: Soybean prices rise as China-U.S. truce assessed
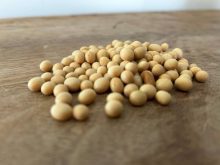
Chicago soybean prices rose on Wednesday, recovering some of the previous session’s losses, as Beijing’s confirmation that it was cutting tariffs on U.S. farm goods put attention back on a trade truce between the countries.
Today Minneapolis also pulled Chicago and Kansas wheat up. They have been lagging behind the spring wheat crop.
Soybeans edged slightly higher and corn was up about one percent.
Old crop July canola jumped $10.50 per tonne or about two percent to $530 a tonne, perhaps indicating some users are worried about supply before the next crop is available. However, the cash to futures basis appears to be widening.
New crop November was up only about a half percent, gaining $2.30 to $484.40 per tonne.
Gains in canola are being limited by the strength of the loonie, now trading close to US77 cents.
STATISTICS CANADA ACREAGE
The Statistics Canada seeded acreage survey was fairly close to what the trade expected so it did little to influence prices today.
CLICK HERE FOR THE DETAILS OF THE REPORT
The USDA releases its planted acreage report on Friday, as well as the quarterly stocks report.
WEATHER
The recent cool weather on the Canadian Prairies is expected to give way to hot weather next week.
Temperatures are forecast in the high 20s and low 30s C.
In North Dakota where drought is already a serious problem temperatures are expected in the mid 30s C and almost no rain is in the 10-day forecast.
The U.S. Midwest is expected to see rain next week.
SASKATCHEWAN CROP REPORT
The weekly crop report from Saskatchewan has a crop condition rating assessment. It said the good-to-excellent percentage for canola was 60 percent (2016-85 percent, 2015-46 percent, 2014-62 percent, 2013-73 percent)
Durum is struggling at 49 percent good to excellent (2016-95%, 2015-29%, 2014-76%, 2013-87%)
Spring wheat is 70 percent good to excellent.
OUTSIDE MARKETS
Light crude oil nearby futures in New York were up 19 cents US$44.93 per barrel.
In the afternoon, the Canadian dollar was trading around US76.92 cents, up from 75.74 cents the previous trading day. The U.S. dollar was C$1.3000.
The Toronto Stock Exchange’s S&P/TSX composite index ended down 142.16 points, or 0.93 percent, at 15,213.42.
Technology stocks were sharply lower on U.S. markets.
the Dow Jones Industrial Average fell 167.58 points, or 0.78 percent, to 21,287.03, the S&P 500 lost 20.99 points, or 0.86 percent, to 2,419.7 and the Nasdaq Composite dropped 90.06 points, or 1.44 percent, to 6,144.35.
Winnipeg ICE Futures Canada dollars per tonne
Canola Jul 2017 530.00 +10.50 +2.02%
Canola Nov 2017 484.40 +2.30 +0.48%
Canola Jan 2018 490.40 +2.40 +0.49%
Canola Mar 2018 495.80 +2.00 +0.41%
Canola May 2018 499.50 unch 0.00%
Milling Wheat Jul 2017 306.00 +12.00 +4.08%
Milling Wheat Oct 2017 296.00 +11.00 +3.86%
Milling Wheat Dec 2017 302.00 +14.00 +4.86%
Durum Wheat Jul 2017 278.00 +1.00 +0.36%
Durum Wheat Oct 2017 270.00 +3.00 +1.12%
Durum Wheat Dec 2017 274.00 +4.00 +1.48%
Barley Jul 2017 138.00 unch 0.00%
Barley Oct 2017 140.00 unch 0.00%
Barley Dec 2017 140.00 unch 0.00%
American crop prices in cents US/bushel, soybean meal in $US/short ton, soy oil in cents US/pound
Chicago
Soybeans Jul 2017 915.50 +1.50 +0.16%
Soybeans Aug 2017 920.75 +1.75 +0.19%
Soybeans Sep 2017 923.25 +2.50 +0.27%
Soybeans Nov 2017 924.75 +3.00 +0.33%
Soybeans Jan 2018 932.75 +3.25 +0.35%
Soybeans Mar 2018 939.25 +3.25 +0.35%
Soybean Meal Jul 2017 294.40 -0.20 -0.07%
Soybean Meal Aug 2017 296.40 -0.20 -0.07%
Soybean Meal Sep 2017 298.10 unch 0.00%
Soybean Oil Jul 2017 32.42 +0.30 +0.93%
Soybean Oil Aug 2017 32.52 +0.27 +0.84%
Soybean Oil Sep 2017 32.63 +0.27 +0.83%
Corn Jul 2017 359.75 +3.00 +0.84%
Corn Sep 2017 369.50 +3.25 +0.89%
Corn Dec 2017 380.00 +3.75 +1.00%
Corn Mar 2018 389.50 +3.50 +0.91%
Corn May 2018 395.75 +3.50 +0.89%
Oats Jul 2017 265.50 -1.00 -0.38%
Oats Sep 2017 264.75 +3.75 +1.44%
Oats Dec 2017 262.75 +4.00 +1.55%
Oats Mar 2018 265.25 +4.50 +1.73%
Oats May 2018 265.00 +4.75 +1.83%
Wheat Jul 2017 480.25 +23.00 +5.03%
Wheat Sep 2017 496.00 +23.00 +4.86%
Wheat Dec 2017 515.50 +20.25 +4.09%
Wheat Mar 2018 529.00 +19.00 +3.73%
Wheat May 2018 538.50 +17.75 +3.41%
Minneapolis
Spring Wheat Jul 2017 741.25 +36.50 +5.18%
Spring Wheat Sep 2017 739.50 +31.50 +4.45%
Spring Wheat Dec 2017 731.25 +30.25 +4.32%
Spring Wheat Mar 2018 721.25 +27.00 +3.89%
Spring Wheat May 2018 711.75 +25.50 +3.72%
Kansas City
Hard Red Wheat Jul 2017 480.50 +19.00 +4.12%
Hard Red Wheat Sep 2017 499.50 +19.25 +4.01%
Hard Red Wheat Dec 2017 524.75 +19.00 +3.76%
Hard Red Wheat Mar 2018 538.75 +18.50 +3.56%
Hard Red Wheat May 2018 547.75 +18.75 +3.54%
Chicago livestock futures in US¢/pound (rounded to two decimal places)
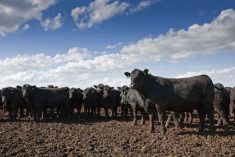
Live Cattle (P) Jun 2017 120.20 -0.05 -0.04%
Live Cattle (P) Aug 2017 116.50 +0.88 +0.76%
Live Cattle (P) Oct 2017 114.98 +1.33 +1.17%
Feeder Cattle (P) Aug 2017 147.17 +0.77 +0.53%
Feeder Cattle (P) Sep 2017 147.20 +0.80 +0.55%
Feeder Cattle (P) Oct 2017 146.08 +1.01 +0.70%
Lean Hogs (P) Jul 2017 89.48 +1.56 +1.77%
Lean Hogs (P) Aug 2017 80.75 +1.28 +1.61%
Lean Hogs (P) Oct 2017 68.65 +0.48 +0.70%