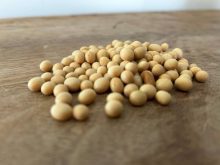
The soybeans sell off resumed Monday, after a brief reprieve Friday.
Canola trotted along behind, falling into red territory with soybeans, the vegetable oil crop leader.
“Canola is largely just following,” said Ken Ball of P.I. Financial in Winnipeg.
From nearly $12 per bushel in early June, November soybean futures have fallen to below $10, closing Monday at $9.66.
That fall from lofty prices was widely anticipated by traders and analysts, but many now think the selloff has been too dramatic and that a bounceback has to come soon.
Read Also

Nutrien tops profit estimates, launches review of phosphate business
Nutrien beat analysts’ expectations for third-quarter profit on Wednesday, and said it would initiate a review of strategic alternatives for its phosphate business.
“The bean market really has been going down too fast,” said Ball.
“It can’t keep going down at this kind of pace or soybeans will be seven bucks by the end of August, and that’s just not going to happen.”
Ball said even a perfect U.S. soybean crop would only justify soybean futures falling to about $8.50, and achieving a perfect crop is unlikely for U.S. farmers.
At some point the selloff has to end, but Ball said few traders will be willing to leap into the market on the assumption that the bottom has been reached.
“If it’s going down 20, 30, 40 cents a day it could go a lot lower,” said Ball.
Wheat rose today on problems in European wheat production, with the French crop appearing far smaller than last year’s.
ed.white@producer.com
Light crude oil nearby futures in New York were down $1.06 to US$43.13 per barrel.
The Canadian dollar at noon was US75.61 cents, down from 75.88 cents the previous trading day. The U.S. dollar at noon was C$1.3225.
The Toronto Stock Exchange’s S&P/TSX composite index ended down 102.56 points, or 0.70 percent, at 14,498.10.
The Dow Jones industrial average dipped 0.42 percent to end at 18,493.06 points and the S&P 500 lost 0.3 percent to 2,168.48.
The Nasdaq Composite edged down 0.05 percent to 5,097.63.
Winnipeg ICE Futures Canada dollars per tonne
Canola Nov 2016 443.90 -7.60 -1.68%
Canola Jan 2017 451.40 -7.50 -1.63%
Canola Mar 2017 458.20 -7.00 -1.50%
Canola May 2017 462.30 -6.30 -1.34%
Canola Jul 2017 465.80 -6.10 -1.29%
Milling Wheat Oct 2016 209.00 +1.00 +0.48%
Durum Wheat Oct 2016 261.00 -6.00 -2.25%
Durum Wheat Dec 2016 264.00 -6.00 -2.22%
Barley Oct 2016 150.00 unch 0.00%
Barley Dec 2016 150.00 unch 0.00%
American crop prices in cents US/bushel, soybean meal in $US/short ton, soy oil in cents US/pound
Chicago
Soybeans Aug 2016 983.75 -24.25 -2.41%
Soybeans Sep 2016 976.75 -23.25 -2.33%
Soybeans Nov 2016 966.25 -22.75 -2.30%
Soybeans Jan 2017 967.00 -22.75 -2.30%
Soybeans Mar 2017 954.75 -28.25 -2.87%
Soybeans May 2017 950.00 -29.00 -2.96%
Soybean Meal Aug 2016 338.90 -8.10 -2.33%
Soybean Meal Sep 2016 338.40 -7.90 -2.28%
Soybean Meal Oct 2016 335.80 -7.50 -2.18%
Soybean Oil Aug 2016 29.46 -0.75 -2.48%
Soybean Oil Sep 2016 29.57 -0.75 -2.47%
Soybean Oil Oct 2016 29.70 -0.75 -2.46%
Corn Sep 2016 334.75 -1.75 -0.52%
Corn Dec 2016 341.25 -2.00 -0.58%
Corn Mar 2017 351.00 -1.50 -0.43%
Corn May 2017 356.75 -2.00 -0.56%
Corn Jul 2017 362.00 -2.00 -0.55%
Oats Sep 2016 204.25 -3.75 -1.80%
Oats Mar 2017 204.25 -2.25 -1.09%
Oats May 2017 208.75 -2.50 -1.18%
Oats Jul 2017 214.50 -2.50 -1.15%
Wheat Sep 2016 429.00 +3.25 +0.76%
Wheat Dec 2016 456.25 +5.50 +1.22%
Wheat Mar 2017 483.50 +8.25 +1.74%
Wheat May 2017 495.75 +8.75 +1.80%
Wheat Jul 2017 502.75 +7.25 +1.46%
Minneapolis
Spring Wheat Sep 2016 497.00 +0.25 +0.05%
Spring Wheat Dec 2016 513.00 +0.75 +0.15%
Spring Wheat Mar 2017 529.00 +1.75 +0.33%
Spring Wheat May 2017 538.75 +3.00 +0.56%
Spring Wheat Jul 2017 548.50 +3.25 +0.60%
Kansas City
Hard Red Wheat Sep 2016 423.25 +3.50 +0.83%
Hard Red Wheat Dec 2016 449.50 +4.00 +0.90%
Hard Red Wheat Mar 2017 466.50 +4.25 +0.92%
Hard Red Wheat May 2017 477.50 +6.75 +1.43%
Hard Red Wheat Jul 2017 487.25 +4.25 +0.88%
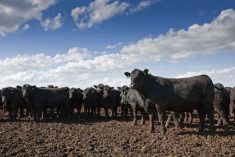
Chicago livestock futures in US¢/pound
Live Cattle (P) Aug 2016 112.95 +2.97 +2.70%
Live Cattle (P) Oct 2016 111.07 +2.97 +2.75%
Live Cattle (P) Dec 2016 112.20 +2.95 +2.70%
Feeder Cattle (P) Aug 2016 141.70 +4.78 +3.49%
Feeder Cattle (P) Sep 2016 140.33 +4.71 +3.47%
Feeder Cattle (P) Oct 2016 139.30 +4.70 +3.49%
Lean Hogs (P) Aug 2016 75.68 +0.48 +0.64%
Lean Hogs (P) Oct 2016 64.35 +0.63 +0.99%
Lean Hogs (P) Dec 2016 59.05 +0.72 +1.23%