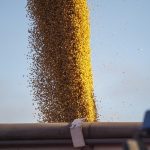
The following port price chart is information extracted from Agriculture Canada’s weekly price summary.
The summary is for information only. The prices are believed to be accurate but are not endorsed by the government of Canada.
The “Indicator Price” is collected from the International Grains Council and industry and represents a sample of FOB asking prices for export. It may not be reflective of actual selling prices.
For comparison’s sake, the PDQinfo.ca website says that on Jan. 7 the spot price in southeastern Saskatchewan for No. 1 13.5 CWRS wheat was about $229 per tonne, for No. 1 CWAD $318 a tonne and for No. 1 canola $448.
| $C/tonne | West Coast
No 1 CWRS 13.5% Protein Indicator price |
St. Lawrence
No 1 CWRS 13.5% Protein Indicator price |
| Jan 8 | 308.41 | 318.41 |
| Jan 1 | 299.17 | 315.62 |
| Dec 25 | 309.00 | 318.10 |
| Jan 9, 2015 | 335.98 | 373.11 |
| $C/tonne | West Coast
No 1 CWAD 13.0% Protein Indicator price* |
St. Lawrence
No 1 CWAD 12.0% Protein Indicator price |
| Jan 8 | 414.04 | 400.47 |
| Jan 1 | 406.93 | 394.95 |
| Dec 25 | 417.00 | 396.32 |
| Jan 9, 2015 | 535.59 | 595.84 |
| $C/tonne | Par Region
Saskatoon No 1 CAN Cash |
Track
Vancouver No 1 CAN Cash |
| Jan 8 | 464.32 | 508.32 |
| Jan 1 | 472.27 | 516.27 |
| Dec 25 | 467.74 | 513.95 |
| Jan 9, 2015 | 431.63 | 491.46 |