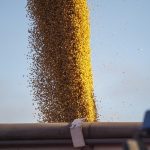
WINNIPEG, Manitoba, Dec 6 (Reuters) – ICE canola futures rose on Friday after a Canadian government report showed the harvest fell well short of expectations after a wet autumn.
* Statistics Canada pegged the Canadian canola harvest at 18.6 million tonnes, 1 million tonnes short of the average trade expectation.
Read Also
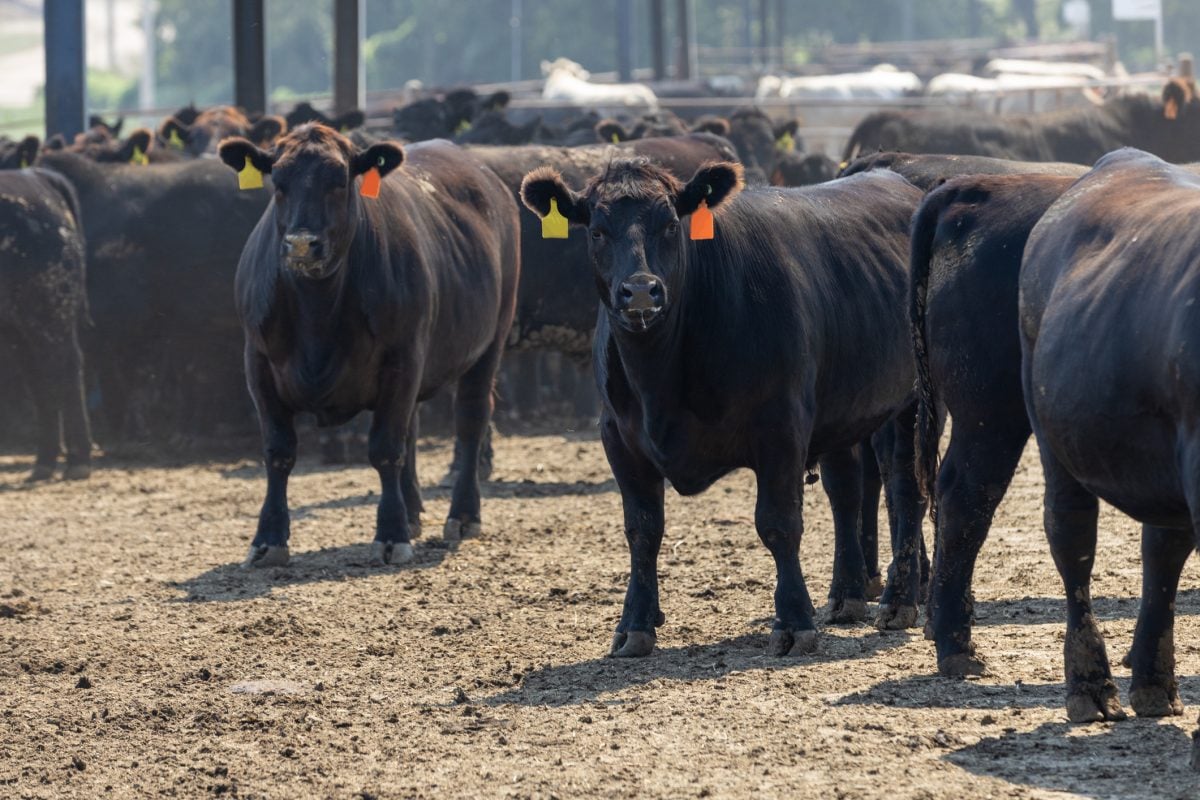
U.S. livestock: Feeder cattle hit contract highs on tight supply
Chicago | Reuters – All Chicago Mercantile Exchange feeder cattle futures and most live cattle futures hit contract highs on…
* A weaker Canadian dollar and strong soyoil prices added to canola‘s strength, a trader said.
* January canola gained $3.90 to $458.40 per tonne in heavy volume.
* January-March canola spread traded 14,104 times, accounting for much of the day’s trading.
* The Canadian dollar weakened against its U.S. counterpart after data showing a surprise slump in domestic jobs raised expectations for a Bank of Canada interest rate cut over the coming months.
* U.S. soy futures rose for a fourth consecutive session as China said it would waive import tariffs for some American farm products, renewing optimism for a possible trade agreement between Washington and Beijing.
* Euronext February rapeseed futures and Malaysian February palm oil futures gained.
OUTSIDE MARKETS
Light crude oil nearby futures in New York was up $2.03 at US$59.12 per barrel.
In the afternoon, the Canadian dollar was down .46 cents at US75.44. The U.S. dollar was C$1.3255, up 77 cents from the previous day.
| Name / Contract | High | Low | Last | Change | Settlement |
| Canola Jan 2020 | 461.10 | 454.30 | 458.10 | 3.60 | 458.10 |
| Canola Mar 2020 | 469.70 | 463.30 | 466.80 | 3.50 | 466.80 |
| Canola May 2020 | 477.60 | 473.30 | 474.40 | 3.00 | 474.40 |
| Canola Jul 2020 | 483.60 | 479.40 | 480.10 | 2.60 | 480.10 |
| Canola Nov 2020 | 484.80 | 481.40 | 482.80 | 3.50 | 482.80 |
| Soybean Jan 2020 | 894.00 | 884.50 | 889.50 | 5.25 | 890.75 |
| Soybean Mar 2020 | 908.50 | 899.00 | 903.75 | 5.00 | 904.75 |
| Soybean May 2020 | 922.75 | 913.75 | 918.25 | 4.75 | 919.00 |
| Soybean Jul 2020 | 935.50 | 926.75 | 931.50 | 4.75 | 932.00 |
| Soybean Aug 2020 | 939.25 | 931.00 | 935.75 | 5.00 | 935.75 |
| Soybean Sep 2020 | 936.75 | 929.50 | 934.00 | 4.75 | 933.75 |
| Soybean Meal Dec 2019 | 301.30 | 296.80 | 297.40 | -2.10 | 298.20 |
| Soybean Meal Jan 2020 | 303.90 | 298.50 | 299.30 | -2.20 | 299.50 |
| Soybean Meal Mar 2020 | 306.70 | 301.80 | 302.50 | -2.10 | 302.50 |
| Soybean Oil Dec 2019 | 31.01 | 30.61 | 31.01 | 0.72 | 30.94 |
| Soybean Oil Jan 2020 | 31.30 | 30.49 | 31.22 | 0.72 | 31.29 |
| Soybean Oil Mar 2020 | 31.57 | 30.79 | 31.50 | 0.71 | 31.57 |
| Corn Dec 2019 | 368.75 | 364.75 | 366.50 | 1.00 | 367.00 |
| Corn Mar 2020 | 379.50 | 375.00 | 376.75 | unch | 377.00 |
| Corn May 2020 | 385.00 | 380.75 | 382.50 | unch | 382.50 |
| Corn Jul 2020 | 389.25 | 385.25 | 386.75 | -0.25 | 387.00 |
| Corn Sep 2020 | 388.00 | 385.25 | 386.75 | 0.50 | 386.75 |
| Oats Dec 2019 | 314.00 | 313.75 | 313.75 | -2.50 | 314.00 |
| Oats Mar 2020 | 296.25 | 290.25 | 292.25 | -3.00 | 292.00 |
| Oats May 2020 | 291.75 | 288.75 | 289.25 | -3.50 | 289.75 |
| Oats Jul 2020 | 285.00 | 284.50 | 284.50 | -2.00 | 285.00 |
| Oats Sep 2020 | 276.25 | 275.25 | 276.25 | -1.50 | 277.75 |
| Wheat Dec 2019 | 532.75 | 529.00 | 532.50 | 0.50 | 529.00 |
| Wheat Mar 2020 | 526.75 | 519.25 | 524.50 | 0.75 | 523.25 |
| Wheat May 2020 | 530.75 | 523.25 | 527.75 | -0.25 | 526.50 |
| Wheat Jul 2020 | 532.50 | 525.75 | 530.00 | unch | 528.25 |
| Wheat Sep 2020 | 538.50 | 532.25 | 536.25 | 0.50 | 534.25 |
| Spring Wheat Dec 2019 | 502.25 | 501.75 | 502.25 | 4.25 | 502.25 |
| Spring Wheat Mar 2020 | 518.75 | 511.50 | 512.25 | -1.50 | 512.25 |
| Spring Wheat May 2020 | 527.50 | 520.50 | 521.75 | -1.00 | 521.75 |
| Spring Wheat Jul 2020 | 536.50 | 529.75 | 529.75 | -2.50 | 529.75 |
| Spring Wheat Sep 2020 | 545.25 | 539.50 | 539.50 | -2.50 | 539.50 |
| Hard Red Wheat Dec 2019 | 426.75 | 415.00 | 415.00 | -5.25 | 420.25 |
| Hard Red Wheat Mar 2020 | 438.25 | 428.75 | 431.00 | -4.50 | 430.25 |
| Hard Red Wheat May 2020 | 446.00 | 437.50 | 439.50 | -3.50 | 438.25 |
| Hard Red Wheat Jul 2020 | 452.50 | 445.25 | 447.50 | -2.25 | 446.75 |
| Hard Red Wheat Sep 2020 | 459.75 | 454.25 | 456.50 | -1.25 | 455.25 |
| Live Cattle (Pit) Dec 2019 | 120.20 | 120.20 | 120.20 | 0.28 | 120.20 |
| Live Cattle (Pit) Feb 2020 | 124.98 | 124.98 | 124.98 | 0.38 | 124.98 |
| Live Cattle (Pit) Apr 2020 | 125.35 | 125.35 | 125.35 | 0.20 | 125.35 |
| Feeder Cattle (Pit) Jan 2020 | 141.55 | 141.55 | 141.55 | 1.00 | 141.55 |
| Feeder Cattle (Pit) Mar 2020 | 141.68 | 141.68 | 141.68 | 0.53 | 141.68 |
| Feeder Cattle (Pit) Apr 2020 | 143.78 | 143.78 | 143.78 | 0.65 | 143.78 |
| Lean Hogs (Pit) Dec 2019 | 61.13 | 61.13 | 61.13 | -0.45 | 61.13 |
| Lean Hogs (Pit) Feb 2020 | 67.55 | 67.55 | 67.55 | -0.03 | 67.55 |
| Lean Hogs (Pit) Apr 2020 | 73.70 | 73.70 | 73.70 | 0.20 | 73.70 |