
Talk that Pakistan had bought 90,000 tonnes of Canadian canola on Monday helped lift May canola $5.20 per tonne or 1.16 percent on Tuesday.
Canola did not get much help from soybeans, which edged up only 0.18 percent in the May contract on concerns about tight stocks. Soy oil slid a fraction. Palm oil was down on Monday on slower than expected Malaysian exports in the first 25 days of March.
Corn was also down on profit taking after recent gains and on China rejecting another cargo because of unapproved GM content.
Read Also

U.S. grains: Soybean futures hit one-month high on U.S.-China trade hopes
Chicago Board of Trade soybean futures hit their highest level in a month on Monday on renewed optimism over U.S.-China trade talks after U.S. President Donald Trump said he believed Beijing would agree to a soybean trade deal and will buy U.S. soy again.
Chicago wheat also was down but Kansas and Minneapolis edged higher in the new crop December contract.
The declining quality of the U.S. winter wheat crop, especially in Texas and Oklahoma, supported wheat. Also forecasts for strong winds on Wednesday that could get the dust blowing on the southern Plains again supported wheat.
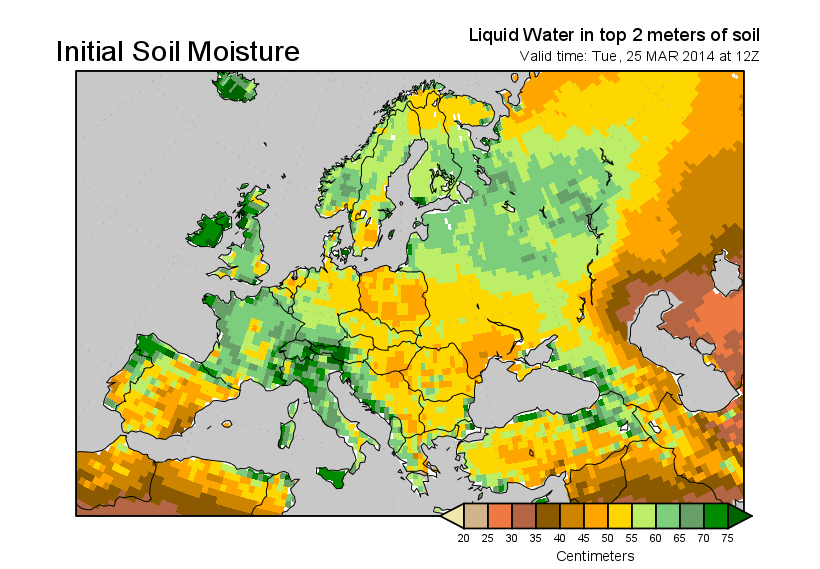
It is also dry in eastern Europe and in Ukraine.
The U.S. Department of Agriculture issues its planting intentions report on Monday March 31.
A Reuters poll of analysts shows U.S. farmers plan to seed a record 81.075 million acres of soybeans based on the average of the forecasts.
The average of the forecasts for corn plantings was 92.748 million acres, down from 95.365 million acres last year.
USDA will also issue a March 1 quarterly grain stocks report.
Analysts in the Reuters poll pegged U.S. soybean stocks at 989 million bushels, down from 998 million a year earlier.
Quarterly stocks of corn are forecast at 7.099 billion bu.
The average trade estimate for U.S. March 1 wheat stocks was 1.042 billion bu., compared with Dec. 1 stocks at 1.463 billion.
The stocks numbers might shed a little light on U.S. demand for feed grains. Demand could be off a little because of the hog losses associated with PED.
The average forecast of U.S. all-wheat plantings ahead of the USDA report was 56.277 million acres. The average for spring wheat other than durum was 12.270 million acres, and the average for durum wheat was 1.794 million.
The Australian weather service today raised its confidence level for an El Nino establishing itself this summer. An El Nino tends to bring dry conditions to Australia where key agricultural regions are already dry.
The current dry conditions in eastern Australia will get a little relief from showers today and tomorrow.
Winnipeg ICE Futures Canada dollars per tonne
Canola May 2014 453.20 +5.20 +1.16%
Canola Jul 2014 462.90 +5.40 +1.18%
Canola Nov 2014 480.20 +5.30 +1.12%
Canola Jan 2015 487.70 +5.40 +1.12%
Canola Mar 2015 494.90 +5.40 +1.10%
Milling Wheat May 2014 229.00 unch 0.00%
Milling Wheat Jul 2014 226.00 unch 0.00%
Milling Wheat Oct 2014 227.00 unch 0.00%
Durum Wheat May 2014 250.00 unch 0.00%
Durum Wheat Jul 2014 250.00 unch 0.00%
Durum Wheat Oct 2014 252.00 unch 0.00%
Barley May 2014 130.50 unch 0.00%
Barley Jul 2014 128.50 unch 0.00%
Barley Oct 2014 128.50 unch 0.00%
American crop prices in cents US/bushel, soybean meal in $US/short ton, soy oil in cents US/pound
Chicago
Soybeans May 2014 1428 +2.5 +0.18%
Soybeans Jul 2014 1401.25 +2.5 +0.18%
Soybeans Aug 2014 1342.25 +4 +0.30%
Soybeans Sep 2014 1246 +4.75 +0.38%
Soybeans Nov 2014 1188.75 +4.75 +0.40%
Soybeans Jan 2015 1192.75 +4.75 +0.40%
Soybean Meal May 2014 463.7 +1.7 +0.37%
Soybean Meal Jul 2014 449.2 +1.5 +0.34%
Soybean Meal Aug 2014 426.2 +1.4 +0.33%
Soybean Oil May 2014 40.74 -0.1 -0.24%
Soybean Oil Jul 2014 40.96 -0.07 -0.17%
Soybean Oil Aug 2014 40.91 +0.03 +0.07%
Corn May 2014 486.5 -3.5 -0.71%
Corn Jul 2014 491.25 -3.25 -0.66%
Corn Sep 2014 488.25 -2.25 -0.46%
Corn Dec 2014 486.25 -1.5 -0.31%
Corn Mar 2015 493.75 -1.75 -0.35%
Oats May 2014 402.25 -15.25 -3.65%
Oats Jul 2014 366.75 -11.75 -3.10%
Oats Sep 2014 342.5 -2.5 -0.72%
Oats Dec 2014 335 -0.75 -0.22%
Oats Mar 2015 332.5 +1.75 +0.53%
Wheat May 2014 708.25 -6.25 -0.87%
Wheat Jul 2014 711.75 -5 -0.70%
Wheat Sep 2014 718.75 -4.75 -0.66%
Wheat Dec 2014 728.25 -4.25 -0.58%
Wheat Mar 2015 733.75 -4 -0.54%
Minneapolis
Spring Wheat May 2014 763 unch 0.00%
Spring Wheat Jul 2014 759.25 unch 0.00%
Spring Wheat Sep 2014 761 unch 0.00%
Spring Wheat Dec 2014 767.75 +1 +0.13%
Spring Wheat Mar 2015 772 unch 0.00%
Kansas City
KC HRW Wheat May 2014 791.75 -2.75 -0.35%
KC HRW Wheat Jul 2014 790.25 unch 0.00%
KC HRW Wheat Sep 2014 792.5 +0.75 +0.09%
KC HRW Wheat Dec 2014 800 +1.75 +0.22%
KC HRW Wheat Mar 2015 799.5 +2.75 +0.35%
Light crude oil nearby futures in New York dropped 41 cents at $99.19 US per barrel.
The Canadian dollar at noon was 89.48 cents US, up from 89.15 cents the previous trading day. The U.S. dollar at noon was $1.1176 Cdn.
Stock markets were buoyed by data that showed U.S. consumer confidence rose more than expected in March, climbing to its highest level since January 2008.
The Toronto Stock Exchange composite index closed up 20.94 points or 0.15 percent at 14,299.49.
The Dow closed up 0.56 percent at 16,367.88.
The Standard and Poor’s 500 closed up 0.49 percent at 1,866.45.
The Nasdaq closed up 0.18 percent at 4,234.03.


