Canola futures edged higher in a generally up day on the markets.
The trade appears to understand that a big South American crop is coming but does not want to bid down prices too early. It has fresh memories of the surprise poor ending to Brazil’s harvest last year.
WEEKLY MARKETS VIDEO WILL BE AVAILABLE THURSDAY MORNING
Many big funds were caught on the wrong side of the market last year when it became clear Brazil’s crop was smaller than expected.
Read Also
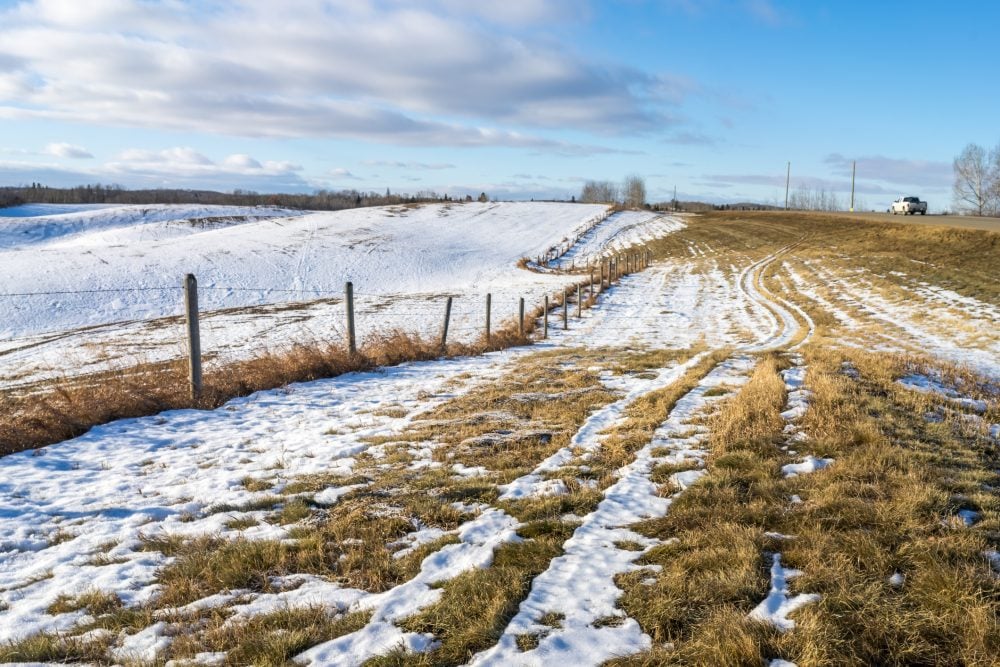
Dryness, drought likely to persist says forecaster
As winter approaches, the dry conditions and drought across much of the Canadian Prairies and the United States Plains will likely persist, said Drew Lerner, meteorologist with World Weather Inc. in Overland Park, Kan.
There has been a lot of rain in Brazil recently but so far the negative impacts appear localized. The harvest remains ahead of last year and the long term average.
A strong monthly soybean crush report from the U.S. National Oilseed Processors Association also supported soybeans.
U.S. monthly inflation data came in higher than expected. Commodities are considered a hedge against inflation.
WHEAT
A few analysts have noted that recent warm weather in the U.S. south could cause wheat to break dormancy early. If that happened, it would put wheat at risk of damage if the temperatures then plunged again.
OUTSIDE MARKETS
Light crude oil nearby futures in New York fell nine cents to US$53.11 per barrel.
The Canadian dollar at noon was US76.43 cents, up from 76.38 cents the previous trading day. The U.S. dollar at noon was C$1.3084.
All major indexes set new record highs on hopes for U.S. tax cuts and strong data on retail sales.
The Toronto Stock Exchange’s S&P/TSX composite index rose 58.92 points, or 0.37 percent, at 15,844.95, a record close.
The Dow Jones Industrial Average rose 0.52 percent to end at 20,611.86. The S&P 500 gained 0.50 percent to 2,349.25 and the Nasdaq Composite added 0.64 percent to 5,819.44.
Winnipeg ICE Futures Canada dollars per tonne
Canola Mar 2017 524.10 +3.00 +0.58%
Canola May 2017 531.90 +2.80 +0.53%
Canola Jul 2017 534.50 +2.70 +0.51%
Canola Nov 2017 507.00 +1.50 +0.30%
Canola Jan 2018 512.50 +1.20 +0.23%
Milling Wheat Mar 2017 242.00 unch 0.00%
Milling Wheat May 2017 246.00 unch 0.00%
Milling Wheat Jul 2017 248.00 +1.00 +0.40%
Durum Wheat Mar 2017 289.00 unch 0.00%
Durum Wheat May 2017 291.00 unch 0.00%
Durum Wheat Jul 2017 287.00 unch 0.00%
Barley Mar 2017 135.00 unch 0.00%
Barley May 2017 137.00 unch 0.00%
Barley Jul 2017 138.00 unch 0.00%
American crop prices in cents US/bushel, soybean meal in $US/short ton, soy oil in cents US/pound
Chicago
Soybeans Mar 2017 1061.25 +16.25 +1.56%
Soybeans May 2017 1071.75 +15.75 +1.49%
Soybeans Jul 2017 1079.75 +15.00 +1.41%
Soybeans Aug 2017 1077.00 +14.25 +1.34%
Soybeans Sep 2017 1055.25 +12.50 +1.20%
Soybeans Nov 2017 1034.25 +11.25 +1.10%
Soybean Meal Mar 2017 346.90 +7.40 +2.18%
Soybean Meal May 2017 351.10 +7.20 +2.09%
Soybean Meal Jul 2017 353.70 +7.00 +2.02%
Soybean Oil Mar 2017 33.94 -0.20 -0.59%
Soybean Oil May 2017 34.22 -0.19 -0.55%
Soybean Oil Jul 2017 34.46 -0.19 -0.55%
Corn Mar 2017 378.75 +4.50 +1.20%
Corn May 2017 386.00 +4.25 +1.11%
Corn Jul 2017 392.50 +4.00 +1.03%
Corn Sep 2017 397.25 +3.50 +0.89%
Corn Dec 2017 402.75 +3.25 +0.81%
Oats Mar 2017 250.50 -3.50 -1.38%
Oats May 2017 248.50 -5.50 -2.17%
Oats Jul 2017 246.00 -4.50 -1.80%
Oats Sep 2017 239.00 -2.75 -1.14%
Oats Dec 2017 238.50 -1.25 -0.52%
Wheat Mar 2017 454.75 +5.25 +1.17%
Wheat May 2017 468.25 +4.75 +1.02%
Wheat Jul 2017 480.00 +4.50 +0.95%
Wheat Sep 2017 493.50 +5.00 +1.02%
Wheat Dec 2017 510.00 +4.25 +0.84%
Minneapolis
Spring Wheat Mar 2017 568.00 -0.25 -0.04%
Spring Wheat May 2017 570.00 +2.00 +0.35%
Spring Wheat Jul 2017 574.00 +3.25 +0.57%
Spring Wheat Sep 2017 577.50 +3.75 +0.65%
Spring Wheat Dec 2017 586.25 +3.50 +0.60%
Kansas City
Hard Red Wheat Mar 2017 469.25 +4.00 +0.86%
Hard Red Wheat May 2017 482.00 +4.00 +0.84%
Hard Red Wheat Jul 2017 493.00 +3.75 +0.77%
Hard Red Wheat Sep 2017 506.50 +4.00 +0.80%
Hard Red Wheat Dec 2017 526.25 +3.50 +0.67%
Chicago livestock futures in US¢/pound (rounded to two decimal places)
Live Cattle (P) Feb 2017 116.78 -0.59 -0.50%
Live Cattle (P) Apr 2017 113.35 -0.65 -0.57%
Live Cattle (P) Jun 2017 104.30 -0.42 -0.40%
Feeder Cattle (P) Mar 2017 124.28 +0.28 +0.23%
Feeder Cattle (P) Apr 2017 124.05 +0.15 +0.12%
Feeder Cattle (P) May 2017 122.88 +0.16 +0.13%
Lean Hogs (P) Apr 2017 70.78 -0.52 -0.73%
Lean Hogs (P) May 2017 75.52 -0.43 -0.57%
Lean Hogs (P) Jun 2017 79.02 -0.36 -0.45%