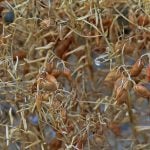
Canola futures dipped Thursday as soybeans also drifted lower.
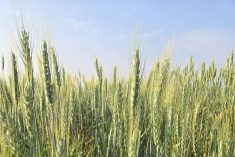
U.S. wheat futures edged higher on an improvement in weekly U.S. export sales, while corn and oats were lower.
Weekly U.S. wheat export sales hit a high for the year at 853,400 tonnes. Corn weekly sales beat market expectations and soybean sales were within the range of expectations.
The pull back in canola futures comes after the oilseed independantly rallied against soybeans in the last couple of weeks. That rally caused the canola crush margin to become less attractive.
Read Also

University of Saskatchewan launches Introductory Agriculture certificate program
A new University of Saskatchewan program is aimed at students or professionals looking for a base of Prairie agricultural knowledge.
The pull back of the last couple of days could reflect a rebalancing between canola and soybeans.
WATCH THIS WEEK’S VIDEO CROP MARKET UPDATE
Generally, there was little crop news to trade on.
The crop market remains a bit on edge over new President Donald Trump’s trade agenda. Mexico’s President Enrique Pena Nieto cancelled a meeting with Trump as tensions rise over the plan to build a wall between the two countries. The White House said today it is proposing a 20 percent tariff on imports from Mexico to raise money to pay for the wall.
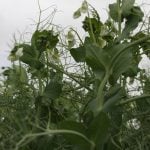
Brazil’s early soybean harvest continues. The weather in Argentina this week is drier, allowing flooded fields to dry.
The Buenos Aires Grains Exchange today pegged Argentina’s 2016-17 soy crop at 53.5 million tonnes. It was the exchange’s first forecast of the season.
The Rosario grain exchange last week forecast the crop at 52.9 million tonnes. Last year’s crop was in the range of 55-56 million tonnes.
North Africa’s wheat area got rain last week.
Stock markets were little changed on Thursday but the Dow remained above the 20,000 point level.
The Toronto Stock Exchange’s S&P/TSX composite index fell 28.32 points, or 0.18 percent, to close at 15,615.52.
The Dow Jones Industrial Average rose 32.40 points, or 0.16 percent, to close at 20,100.91, the S&P 500 lost 1.69 points, or 0.07 percent, to 2,296.68 and the Nasdaq Composite dropped 1.16 points, or 0.02 percent, to 5,655.18.
Light crude oil nearby futures in New York were up $1.03 to US$53.78 per barrel.
The Canadian dollar at noon was US76.31 cents, down from 76.48 cents the previous trading day. The U.S. dollar at noon was C$1.3104.
Winnipeg ICE Futures Canada dollars per tonne
Canola Mar 2017 520.30 -2.10 -0.40%
Canola May 2017 527.20 -2.20 -0.42%
Canola Jul 2017 531.20 -2.60 -0.49%
Canola Nov 2017 506.40 +0.30 +0.06%
Canola Jan 2018 510.50 +1.30 +0.26%
Milling Wheat Mar 2017 237.00 +1.00 +0.42%
Milling Wheat May 2017 238.00 -1.00 -0.42%
Milling Wheat Jul 2017 239.00 -1.00 -0.42%
Durum Wheat Mar 2017 302.00 -4.00 -1.31%
Durum Wheat May 2017 305.00 -4.00 -1.29%
Durum Wheat Jul 2017 314.00 unch 0.00%
Barley Mar 2017 139.00 unch 0.00%
Barley May 2017 141.00 unch 0.00%
Barley Jul 2017 142.00 unch 0.00%
American crop prices in cents US/bushel, soybean meal in $US/short ton, soy oil in cents US/pound
Chicago
Soybeans Mar 2017 1049.50 -5.75 -0.54%
Soybeans May 2017 1059.00 -5.50 -0.52%
Soybeans Jul 2017 1065.75 -5.25 -0.49%
Soybeans Aug 2017 1062.50 -5.25 -0.49%
Soybeans Sep 2017 1042.50 -3.25 -0.31%
Soybeans Nov 2017 1023.25 -2.25 -0.22%
Soybean Meal Mar 2017 342.40 -0.90 -0.26%
Soybean Meal May 2017 345.50 -0.80 -0.23%
Soybean Meal Jul 2017 347.50 -0.90 -0.26%
Soybean Oil Mar 2017 34.47 -0.40 -1.15%
Soybean Oil May 2017 34.74 -0.38 -1.08%
Soybean Oil Jul 2017 34.98 -0.38 -1.07%
Corn Mar 2017 363.75 -2.50 -0.68%
Corn May 2017 371.00 -2.50 -0.67%
Corn Jul 2017 378.00 -2.75 -0.72%
Corn Sep 2017 384.25 -2.75 -0.71%
Corn Dec 2017 390.75 -3.00 -0.76%
Oats Mar 2017 255.25 -4.75 -1.83%
Oats May 2017 247.25 -2.00 -0.80%
Oats Jul 2017 244.00 -1.50 -0.61%
Oats Sep 2017 239.25 -1.50 -0.62%
Oats Dec 2017 232.75 -1.50 -0.64%
Wheat Mar 2017 427.00 +2.50 +0.59%
Wheat May 2017 440.50 +2.00 +0.46%
Wheat Jul 2017 455.00 +1.50 +0.33%
Wheat Sep 2017 469.75 +1.25 +0.27%
Wheat Dec 2017 486.75 +0.75 +0.15%
Minneapolis
Spring Wheat Mar 2017 566.75 +9.25 +1.66%
Spring Wheat May 2017 558.50 +5.25 +0.95%
Spring Wheat Jul 2017 558.25 +4.75 +0.86%
Spring Wheat Sep 2017 559.75 +4.50 +0.81%
Spring Wheat Dec 2017 565.75 +4.25 +0.76%
Kansas City
Hard Red Wheat Mar 2017 440.25 +2.50 +0.57%
Hard Red Wheat May 2017 452.50 +2.75 +0.61%
Hard Red Wheat Jul 2017 464.50 +3.00 +0.65%
Hard Red Wheat Sep 2017 478.75 +3.00 +0.63%
Hard Red Wheat Dec 2017 499.00 +2.75 +0.55%
Chicago livestock futures in US¢/pound (rounded to two decimal places)
Live Cattle (P) Feb 2017 118.70 -1.18 -0.98%
Live Cattle (P) Apr 2017 117.58 -1.10 -0.93%
Live Cattle (P) Jun 2017 107.20 -0.90 -0.83%
Feeder Cattle (P) Jan 2017 131.82 -0.56 -0.42%
Feeder Cattle (P) Mar 2017 127.10 -2.75 -2.12%
Feeder Cattle (P) Apr 2017 126.75 -2.63 -2.03%
Lean Hogs (P) Feb 2017 65.85 -1.68 -2.49%
Lean Hogs (P) Apr 2017 67.22 -2.93 -4.18%
Lean Hogs (P) May 2017 72.12 -2.58 -3.45%