Canola futures were mostly lower on Friday as only the May contract closed higher.
The stronger loonie weighed on the canola market.
Oilseeds generally were pressured lower by a weaker than expected monthly crush number from the U.S. National Oilseed Processors Association. The February crush was 136.322 million bushels, down from pre report estimate of 141.6 million.
May canola closed at $623.20, up 10 cents. Jul closed at $609.40, down $1.10. Nov $551.90, down $1.10.
On the week, May canola fell $4.60 and November fell $9.90.
• The Canadian Oilseed Processors Association reported members crushed 132,856 tonnes of canola in the week ending March 13, up 0.7 percent from the week before.
Read Also
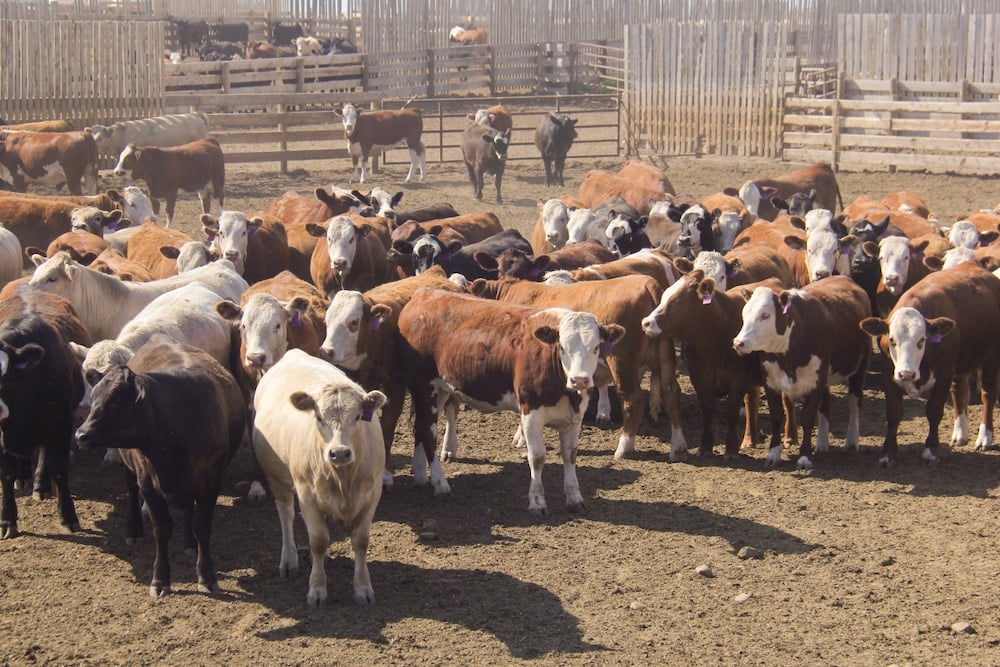
U.S. livestock: Feeder cattle rise to new highs on tight supply, strong cash prices
Chicago | Reuters – Chicago Mercantile Exchange feeder cattle futures rallied on Thursday to a record high on strong cash…
That represented a crush capacity used of almost 80 percent, compared to the year to date rate of 88 percent.
• Frost is expected in Argentine growing zones on Saturday, but the crop is mostly mature and damage is expected to be limited.
• Argentina’s government pegged its soybean crop at 51-52 million tonnes and the corn crop at 27 million. Several private analysts put the soybean crop at less than 50 million tonnes.
USDA’s March report pegged Argentina’s soy crop at 51.5 million tonnes.
• A grower survey for private forecaster Allendale forecasts U.S. corn area at 96.956 million acres, down from 97.255 last year. Soybeans area is forecast at 78.324 million acres, up 1.126 million from last year a record high.
Allendale forecast U.S. wheat area at 56.261 million acres, up 209,000 from USDA current outlook.
The corn acreage forecast, applied to its yield forecast of 156.97 bu. per acre, implies a corn crop of 13.912 billion bu., up from 10.78 billion last year.
Winnipeg ICE Futures Canada priced in Cdn dollars per tonne
Canola May 2013 623.20 +0.10 +0.02%
Canola Jul 2013 609.40 -1.10 -0.18%
Canola Nov 2013 551.90 -1.10 -0.20%
Canola Jan 2014 551.30 -1.30 -0.24%
Canola Mar 2014 550.50 -1.30 -0.24%
Milling Wheat May 2013 292.00 unch 0.00%
Milling Wheat Jul 2013 294.00 unch 0.00%
Milling Wheat Oct 2013 294.00 unch 0.00%
Durum Wheat May 2013 311.00 unch 0.00%
Durum Wheat Jul 2013 314.00 unch 0.00%
Durum Wheat Oct 2013 299.30 unch 0.00%
Barley May 2013 243.00 unch 0.00%
Barley Jul 2013 243.50 unch 0.00%
Barley Oct 2013 243.50 unch 0.00%
U.S. crop futures in US cents/bushel. Soy meal in US dollars/short ton, soy oil in US cents/pound.
Chicago
Soybeans May 2013 1426 -9.5 -0.66%
Soybeans Jul 2013 1410.75 -5.25 -0.37%
Soybeans Aug 2013 1370.25 -5.5 -0.40%
Soybeans Sep 2013 1301.5 unch 0.00%
Soybeans Nov 2013 1261 +1.25 +0.10%
Soybeans Jan 2014 1265.75 +2 +0.16%
Soybean Meal May 2013 418.8 -6.2 -1.46%
Soybean Meal Jul 2013 413.2 -5.1 -1.22%
Soybean Meal Aug 2013 396.7 -4.8 -1.20%
Soybean Oil May 2013 49.91 +0.57 +1.16%
Soybean Oil Jul 2013 50.14 +0.56 +1.13%
Soybean Oil Aug 2013 50.09 +0.52 +1.05%
Corn May 2013 717 +0.5 +0.07%
Corn Jul 2013 700.25 +1.75 +0.25%
Corn Sep 2013 586.75 +2.75 +0.47%
Corn Dec 2013 561.75 +2.5 +0.45%
Corn Mar 2014 571 +2 +0.35%
Oats May 2013 401.75 +5.25 1.32%
Oats Jul 2013 388.5 +3.25 0.84%
Oats Sep 2013 377 +3.25 0.87%
Oats Dec 2013 364.25 -1.5 -0.41%
Oats Mar 2014 376.25 -1.5 -0.40%
Wheat May 2013 723 -1.75 -0.24%
Wheat Jul 2013 721.25 +1.25 +0.17%
Wheat Sep 2013 726.75 +2.25 +0.31%
Wheat Dec 2013 739 +2.5 +0.34%
Wheat Mar 2014 751.25 +3 +0.40%
Minneapolis
Spring Wheat May 2013 796.25 -4.75 -0.59%
Spring Wheat Jul 2013 796.25 -3.5 -0.44%
Spring Wheat Sep 2013 796.25 -3.25 -0.41%
Spring Wheat Dec 2013 802.5 -1.75 -0.22%
Spring Wheat Mar 2014 811.25 -4.25 -0.52%
Kansas City
KCBT Red Wheat May 2013 751.5 -1.25 -0.17%
KCBT Red Wheat Jul 2013 755.75 -0.5 -0.07%
KCBT Red Wheat Sep 2013 767.5 -0.25 -0.03%
KCBT Red Wheat Dec 2013 782.25 -0.25 -0.03%
KCBT Red Wheat Mar 2014 793.25 +1.25 +0.16%
The Bank of Canada noon rate for the loonie was 98.11 cents US, up more than half a cent from 97.46 on Thursday at noon.
The U.S. buck was $1.0193 Cdn.
Nearby crude oil in New York rose 42 cents to $93.45 per barrel.
U.S. stocks slipped on Friday, ending the Dow Jones industrial average’s longest winning streak since 1996 as investors paused just below the S&P 500’s record high.
U.S. consumer prices rose the most in almost four years as the cost of gasoline rose, Reuters reported. But a smaller gain in the core U.S. Consumer Price Index, which excludes volatile food and energy prices, left the door open for the Federal Reserve to continue its bond-buying program, a stimulus that has contributed to the stock market’s rally.
The TSX composite closed up 30.12 points or 0.24 percent at 12,830.03
The Dow Jones industrial average slipped 25.03 points, or 0.17 percent, to 14,514.11 at the close.
The Standard & Poor’s 500 Index shed 2.53 points, or 0.16 percent, to 1,560.70.
The Nasdaq Composite Index dropped 9.86 points, or 0.30 percent, to end at 3,249.07.
For the week, the S&P/TSX was virtually unchanged, the Dow rose 0.8 percent, the S&P 500 rose 0.6 percent and the Nasdaq gained 0.15 percent.