WINNIPEG, Manitoba, Sept 9 (Reuters) – ICE Canada canola futures rose on Friday, boosted by technical buying, and notched a small weekly gain.
* Exporters and crushers may also have been buyers, a trader said.
* Canadian and Chinese officials held productive talks last week on a dispute over canola exports and will meet again next week, Trade Minister Chrystia Freeland said.
* November canola rose $2.40 at $465.70 per tonne. Gained 0.3 percent for the week.
* January canola added $2.30 at $472.50.
* November-January canola spread traded 1,825 times.
Read Also

Most of Manitoba harvest wraps up for 2025
Manitoba Agriculture issued its final crop report of 2025, showing the overall provincewide harvest at 97 per cent complete as of Oct. 20. Nearly all major crops have finished combining, with 37 per cent of Manitoba’s sunflowers finished, plus 71 per cent of grain corn and small amounts of soybeans and potatoes left to do.
* Chicago November soybeans edged higher on export demand.
* NYSE Liffe November rapeseed and October Malaysian crude palm oil rose.
* The Canadian dollar was trading at $1.3046 to the U.S. dollar, or 76.65 U.S. cents at 12:47 p.m. CDT (1747 GMT), lower than Thursday’s close of $1.2928, or 77.35 U.S.
* Canada weekly canola crushings rose 5.6 percent.
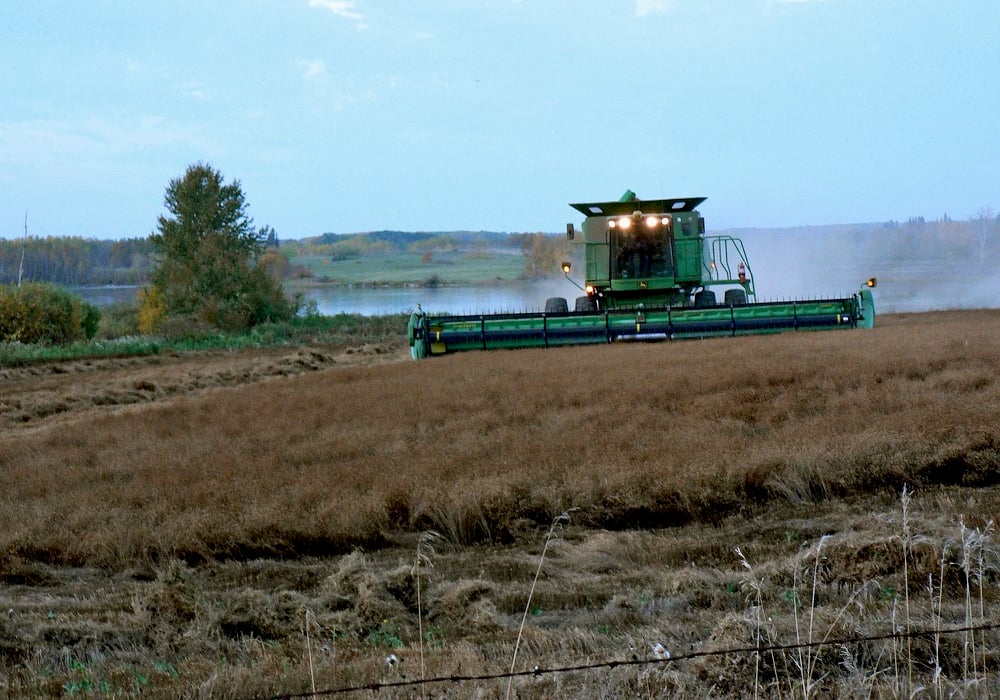
* Wet weather slowed harvest in Alberta.
Light crude oil nearby futures in New York were down $1.74 to US$45.88 per barrel.
The Canadian dollar at noon was US76.73 cents, down from 77.47 cents the previous trading day. The U.S. dollar at noon was C$1.3033.
Winnipeg ICE Futures Canada dollars per tonne
Canola Nov 2016 465.70 +2.40 +0.52%
Canola Jan 2017 472.50 +2.30 +0.49%
Canola Mar 2017 477.80 +1.50 +0.31%
Canola May 2017 483.20 +1.00 +0.21%
Canola Jul 2017 487.30 +0.30 +0.06%
Milling Wheat Oct 2016 209.00 +5.00 +2.45%
Milling Wheat Dec 2016 212.00 +5.00 +2.42%
Durum Wheat Oct 2016 263.00 unch 0.00%
Durum Wheat Dec 2016 265.00 unch 0.00%
Durum Wheat Mar 2017 268.00 unch 0.00%
Barley Oct 2016 138.00 unch 0.00%
Barley Dec 2016 138.00 unch 0.00%
Barley Mar 2017 140.00 unch 0.00%
American crop prices in cents US/bushel, soybean meal in $US/short ton, soy oil in cents US/pound
Chicago
Soybeans Sep 2016 997.25 +5.25 +0.53%
Soybeans Nov 2016 980.25 +3.50 +0.36%
Soybeans Jan 2017 984.25 +3.75 +0.38%
Soybeans Mar 2017 987.50 +3.50 +0.36%
Soybeans May 2017 991.00 +3.50 +0.35%
Soybeans Jul 2017 994.25 +4.00 +0.40%
Soybean Meal Sep 2016 323.30 -1.80 -0.55%
Soybean Meal Oct 2016 317.70 -1.70 -0.53%
Soybean Meal Dec 2016 316.50 -1.10 -0.35%
Soybean Oil Sep 2016 33.03 +0.09 +0.27%
Soybean Oil Oct 2016 33.10 +0.10 +0.30%
Soybean Oil Dec 2016 33.37 +0.10 +0.30%
Corn Sep 2016 330.00 +3.00 +0.92%
Corn Dec 2016 341.00 +2.50 +0.74%
Corn Mar 2017 351.50 +3.00 +0.86%
Corn May 2017 358.75 +3.00 +0.84%
Corn Jul 2017 365.25 +2.75 +0.76%
Oats Sep 2016 164.25 -0.75 -0.45%
Oats Dec 2016 177.25 -0.50 -0.28%
Oats Mar 2017 190.50 unch 0.00%
Oats May 2017 197.00 +1.00 +0.51%
Oats Jul 2017 203.50 +0.25 +0.12%
Wheat Sep 2016 376.00 -1.00 -0.27%
Wheat Mar 2017 424.75 -2.50 -0.59%
Wheat May 2017 439.50 -1.50 -0.34%
Wheat Jul 2017 451.00 -1.75 -0.39%
Minneapolis
Spring Wheat Sep 2016 498.50 +3.50 +0.71%
Spring Wheat Dec 2016 494.00 +2.00 +0.41%
Spring Wheat Mar 2017 504.75 +1.25 +0.25%
Spring Wheat May 2017 514.00 +1.25 +0.24%
Spring Wheat Jul 2017 523.50 +1.25 +0.24%
Kansas City
Hard Red Wheat Sep 2016 393.50 +1.00 +0.25%
Hard Red Wheat Dec 2016 418.50 +0.50 +0.12%
Hard Red Wheat Mar 2017 434.50 +0.50 +0.12%
Hard Red Wheat May 2017 445.00 +0.25 +0.06%
Hard Red Wheat Jul 2017 455.00 +0.50 +0.11%
Chicago livestock futures in US¢/pound (rounded to two decimal places)
Live Cattle (P) Oct 2016 104.40 +3.00 +2.96%
Live Cattle (P) Dec 2016 105.40 +2.80 +2.73%
Live Cattle (P) Feb 2017 105.55 +2.33 +2.26%
Feeder Cattle (P) Sep 2016 134.22 +2.62 +1.99%
Feeder Cattle (P) Oct 2016 131.28 +2.78 +2.16%
Feeder Cattle (P) Nov 2016 128.68 +2.41 +1.91%
Lean Hogs (P) Oct 2016 59.23 -1.77 -2.90%
Lean Hogs (P) Dec 2016 53.92 -1.56 -2.81%
Lean Hogs (P) Feb 2017 58.78 -1.27 -2.11%


