WINNIPEG, Manitoba, Sept 30 (Reuters) – ICE Canada canola futures dropped on Friday for the fifth time in six sessions, on a boost in commercial hedge selling, notching a 1 percent weekly loss.
* Hedges picked up as farmers’ harvesting advanced, a trader said. In Alberta, 40 percent of canola is harvested.
* Market was underpinned by buying related to gains in Chicago soybeans.
* November canola dropped $1.50 at $463.60 per tonne. Earlier, the contract touched a 10-day low.
* For the month, most-active canola gained 1 percent.
* January canola lost $2 at $470.70.
Read Also
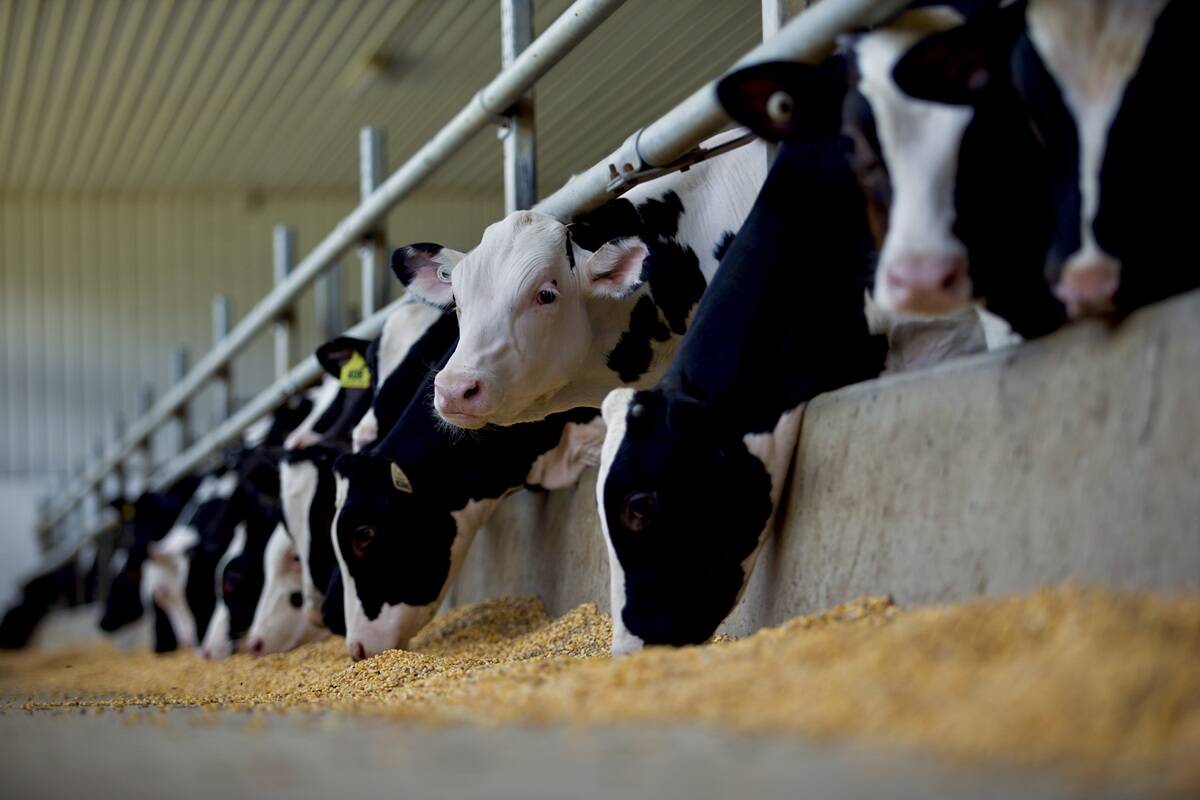
Confusion cleared on Canadian calf import changes
A Canadian Food Inspection Agency (CFIA) announcement on import regulations for feeder calves caused some confusion on the administrative side of Canada’s cattle industry earlier this month
* November-January canola spread traded 2,829 times.
* Chicago November soybeans rose on a government report of smaller than expected U.S. stocks.
* The U.S. Agriculture Department reported corn and soybean stocks as of Sept. 1 at multi-year highs despite record usage of both commodities during the June, July and August time period.
* NYSE Liffe November rapeseed eased and Malaysian November crude palm oil rose.
* The Canadian dollar was trading at $1.3122 to the U.S. dollar, or 76.21 U.S. cents at 12:46 p.m. CDT (1746 GMT), higher than Thursday’s close of $1.3149, or 76.05 U.S. cents.
* Canada weekly canola crushings fell 8.1 percent.
Light crude oil nearby futures in New York were up 41 cents to US$48.24 per barrel.
Winnipeg ICE Futures Canada dollars per tonne
Canola Nov 2016 463.60 -1.50 -0.32%
Canola Jan 2017 470.70 -2.00 -0.42%
Canola Mar 2017 475.90 -1.80 -0.38%
Canola May 2017 481.00 -1.30 -0.27%
Canola Jul 2017 484.30 -0.80 -0.16%
Milling Wheat Oct 2016 224.00 +4.00 +1.82%
Milling Wheat Dec 2016 227.00 +4.00 +1.79%
Milling Wheat Mar 2017 232.00 +4.00 +1.75%
Durum Wheat Oct 2016 283.00 +2.00 +0.71%
Durum Wheat Dec 2016 282.00 +2.00 +0.71%
Durum Wheat Mar 2017 289.00 +3.00 +1.05%
Barley Oct 2016 132.50 unch 0.00%
Barley Dec 2016 132.50 unch 0.00%
Barley Mar 2017 134.50 unch 0.00%
American crop prices in cents US/bushel, soybean meal in $US/short ton, soy oil in cents US/pound
Chicago
Soybeans Nov 2016 954.00 +3.75 +0.39%
Soybeans Jan 2017 959.25 +3.00 +0.31%
Soybeans Mar 2017 965.50 +2.50 +0.26%
Soybeans May 2017 971.75 +2.25 +0.23%
Soybeans Jul 2017 977.25 +2.50 +0.26%
Soybeans Aug 2017 976.00 +2.25 +0.23%
Soybean Meal Oct 2016 297.90 unch 0.00%
Soybean Meal Dec 2016 299.60 +0.90 +0.30%
Soybean Meal Jan 2017 300.20 +0.40 +0.13%
Soybean Oil Oct 2016 33.24 +0.15 +0.45%
Soybean Oil Dec 2016 33.44 +0.10 +0.30%
Soybean Oil Jan 2017 33.67 +0.09 +0.27%
Corn Dec 2016 336.75 +7.50 +2.28%
Corn Mar 2017 346.50 +7.50 +2.21%
Corn May 2017 353.50 +7.50 +2.17%
Corn Sep 2017 367.00 +7.00 +1.94%
Oats Dec 2016 178.25 +2.25 +1.28%
Oats Mar 2017 187.00 +1.75 +0.94%
Oats May 2017 191.25 +1.00 +0.53%
Oats Jul 2017 198.50 -1.00 -0.50%
Oats Sep 2017 199.50 -1.00 -0.50%
Wheat Dec 2016 402.00 +3.00 +0.75%
Wheat Mar 2017 424.75 +3.00 +0.71%
Wheat May 2017 438.00 +2.50 +0.57%
Wheat Jul 2017 447.50 +1.25 +0.28%
Wheat Sep 2017 461.75 +1.75 +0.38%
Minneapolis
Spring Wheat Dec 2016 514.50 +4.75 +0.93%
Spring Wheat Mar 2017 521.00 +3.75 +0.72%
Spring Wheat May 2017 527.75 +3.00 +0.57%
Spring Wheat Jul 2017 535.50 +2.50 +0.47%
Spring Wheat Sep 2017 543.25 +1.25 +0.23%
Kansas City
Hard Red Wheat Dec 2016 415.50 -1.75 -0.42%
Hard Red Wheat Mar 2017 432.00 -1.75 -0.40%
Hard Red Wheat May 2017 442.50 -1.50 -0.34%
Hard Red Wheat Jul 2017 452.50 -1.50 -0.33%
Hard Red Wheat Sep 2017 467.00 -1.00 -0.21%
Chicago livestock futures in US¢/pound (rounded to two decimal places)
Live Cattle (P) Oct 2016 98.90 -3.00 -2.94%
Live Cattle (P) Dec 2016 100.12 -3.01 -2.92%
Live Cattle (P) Feb 2017 100.60 -2.83 -2.74%
Feeder Cattle (P) Oct 2016 123.15 -4.35 -3.41%
Feeder Cattle (P) Nov 2016 119.65 -4.27 -3.45%
Feeder Cattle (P) Jan 2017 116.82 -3.81 -3.16%
Lean Hogs (P) Oct 2016 49.02 -3.01 -5.79%
Lean Hogs (P) Dec 2016 43.98 -3.00 -6.39%
Lean Hogs (P) Feb 2017 48.90 -2.70 -5.23%


