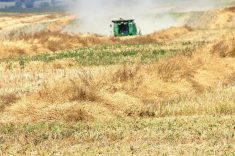
WINNIPEG, Manitoba, Sept 12 (Reuters) – ICE Canada canola futures fell on Monday, weighed down with fellow oilseeds after the U.S. Department of Agriculture (USDA) increased its record-large domestic yield estimate more than expected.
* The agency pegged the average U.S. soybean yield at 50.6 bushels per acre in a monthly report, up from 48.9 bushels in August.
* November canola lost $6.60 at $459.10 per tonne.
* January canola gave up $7.20 at $465.30.
* November-January canola spread traded 2,111 times.
* Chicago November soybeans fell after the bearish USDA yield estimate.
Read Also
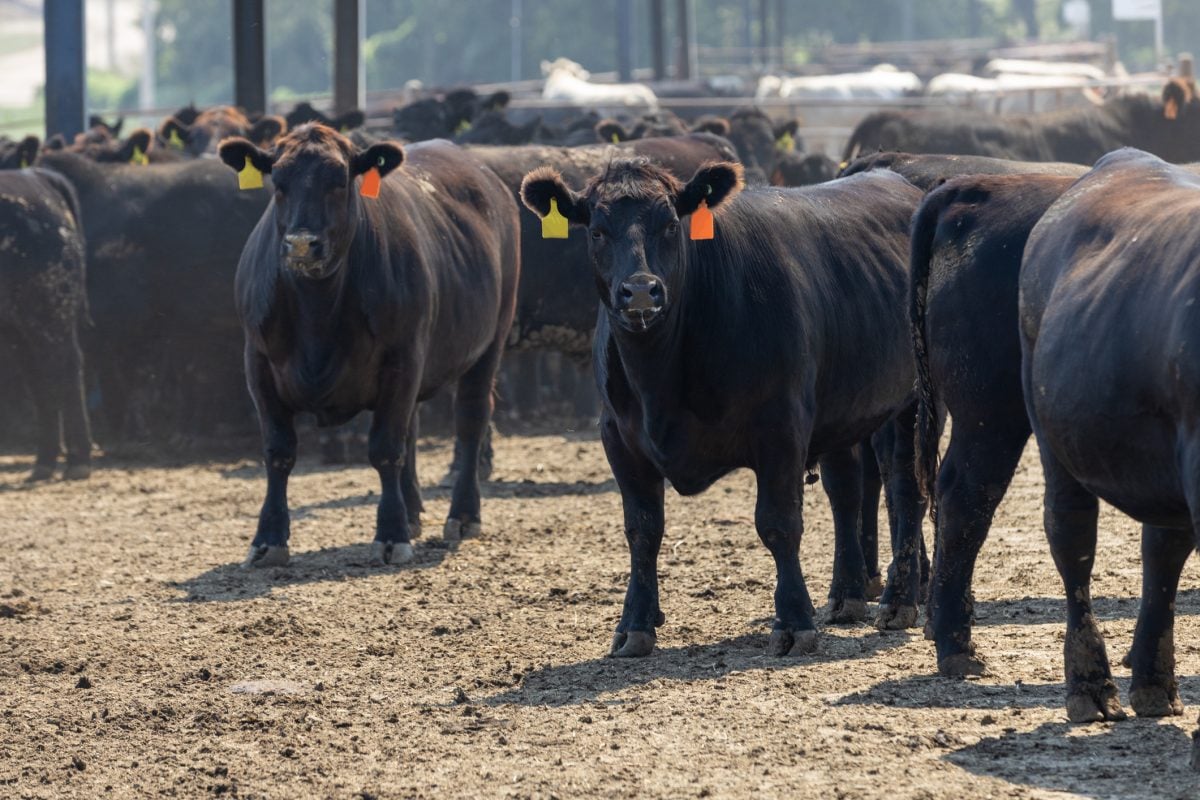
U.S. livestock: Cattle regain ground, hogs dip
Chicago cattle futures regained ground on Wednesday after falling off a cliff late last week. Most-active December live cattle contracts…
* NYSE Liffe November rapeseed dropped.
Light crude oil nearby futures in New York were up 41 cents to US$46.29 per barrel.
The Canadian dollar at noon was US76.47 cents, down from 76.73 cents the previous trading day. The U.S. dollar at noon was C$1.3077.
Winnipeg ICE Futures Canada dollars per tonne
Canola Nov 2016 459.10 -6.60 -1.42%
Canola Jan 2017 465.30 -7.20 -1.52%
Canola Mar 2017 470.20 -7.60 -1.59%
Canola May 2017 475.20 -8.00 -1.66%
Canola Jul 2017 478.60 -8.70 -1.79%
Milling Wheat Oct 2016 212.00 +3.00 +1.44%
Milling Wheat Dec 2016 214.00 +2.00 +0.94%
Milling Wheat Mar 2017 219.00 +3.00 +1.39%
Durum Wheat Oct 2016 265.00 +2.00 +0.76%
Durum Wheat Dec 2016 267.00 +2.00 +0.75%
Durum Wheat Mar 2017 270.00 +2.00 +0.75%
Barley Oct 2016 138.00 unch 0.00%
Barley Dec 2016 138.00 unch 0.00%
Barley Mar 2017 140.00 unch 0.00%
American crop prices in cents US/bushel, soybean meal in $US/short ton, soy oil in cents US/pound
Chicago
Soybeans Nov 2016 964.25 -13.75 -1.41%
Soybeans Jan 2017 968.75 -12.75 -1.30%
Soybeans Mar 2017 971.50 -13.50 -1.37%
Soybeans May 2017 976.00 -12.25 -1.24%
Soybeans Jul 2017 980.50 -11.25 -1.13%
Soybean Meal Sep 2016 318.30 -4.20 -1.30%
Soybean Meal Oct 2016 313.50 -3.30 -1.04%
Soybean Meal Dec 2016 311.90 -3.70 -1.17%
Soybean Oil Sep 2016 32.31 -0.68 -2.06%
Soybean Oil Oct 2016 32.38 -0.67 -2.03%
Soybean Oil Dec 2016 32.64 -0.70 -2.10%
Corn Sep 2016 329.25 +0.25 +0.08%
Corn Dec 2016 339.50 -0.50 -0.15%
Corn Mar 2017 350.00 -0.75 -0.21%
Corn May 2017 357.50 -0.25 -0.07%
Corn Jul 2017 364.00 unch 0.00%
Oats Sep 2016 162.00 -7.00 -4.14%
Oats Dec 2016 174.75 -2.25 -1.27%
Oats Mar 2017 187.75 -3.00 -1.57%
Oats May 2017 194.00 -5.00 -2.51%
Oats Jul 2017 201.50 unch 0.00%
Wheat Sep 2016 383.25 +6.50 +1.73%
Wheat Dec 2016 409.25 +6.75 +1.68%
Wheat Mar 2017 430.00 +6.50 +1.53%
Wheat May 2017 444.75 +6.25 +1.43%
Wheat Jul 2017 455.00 +5.25 +1.17%
Minneapolis
Spring Wheat Sep 2016 499.75 +1.25 +0.25%
Spring Wheat Dec 2016 499.00 +5.50 +1.11%
Spring Wheat Mar 2017 509.75 +5.25 +1.04%
Spring Wheat May 2017 518.75 +5.25 +1.02%
Kansas City
Hard Red Wheat Sep 2016 399.75 +7.00 +1.78%
Hard Red Wheat Dec 2016 423.75 +6.75 +1.62%
Hard Red Wheat Mar 2017 439.50 +6.50 +1.50%
Hard Red Wheat May 2017 450.00 +6.25 +1.41%
Hard Red Wheat Jul 2017 459.75 +6.00 +1.32%
Chicago livestock futures in US¢/pound (rounded to two decimal places)
Live Cattle (P) Oct 2016 105.70 +1.30 +1.25%
Live Cattle (P) Dec 2016 106.72 +1.57 +1.49%
Live Cattle (P) Feb 2017 106.80 +1.30 +1.23%
Feeder Cattle (P) Sep 2016 134.92 +1.22 +0.91%
Feeder Cattle (P) Oct 2016 132.30 +1.65 +1.26%
Feeder Cattle (P) Nov 2016 129.88 +1.78 +1.39%
Lean Hogs (P) Oct 2016 59.42 +0.12 +0.20%
Lean Hogs (P) Dec 2016 53.02 -1.08 -2.00%
Lean Hogs (P) Feb 2017 57.78 -1.15 -1.95%