The crop market on Tuesday gave back most of the gains it made on Monday, pressured lower by steady U.S. crop condition ratings and China’s surprise devaluation of its currency.
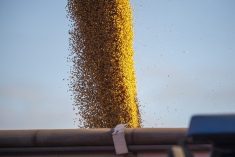
Corn led the market higher on Monday and was the big loser today, with December falling about 3.4 percent.
November soybeans were down 2.3 percent and spring wheat was down 2.8 percent.
A weaker loonie, down about a half cent against the American greenback, helped cushion the blow in canola, with the November contract down 0.74 percent.
Traders on average had expected a one percentage point drop in the weekly good-to-excellent ratings of U.S. corn and soybeans due to recent dry weather in the Midwest. However, when the ratings came out Monday afternoon, they were almost unchanged.
Read Also
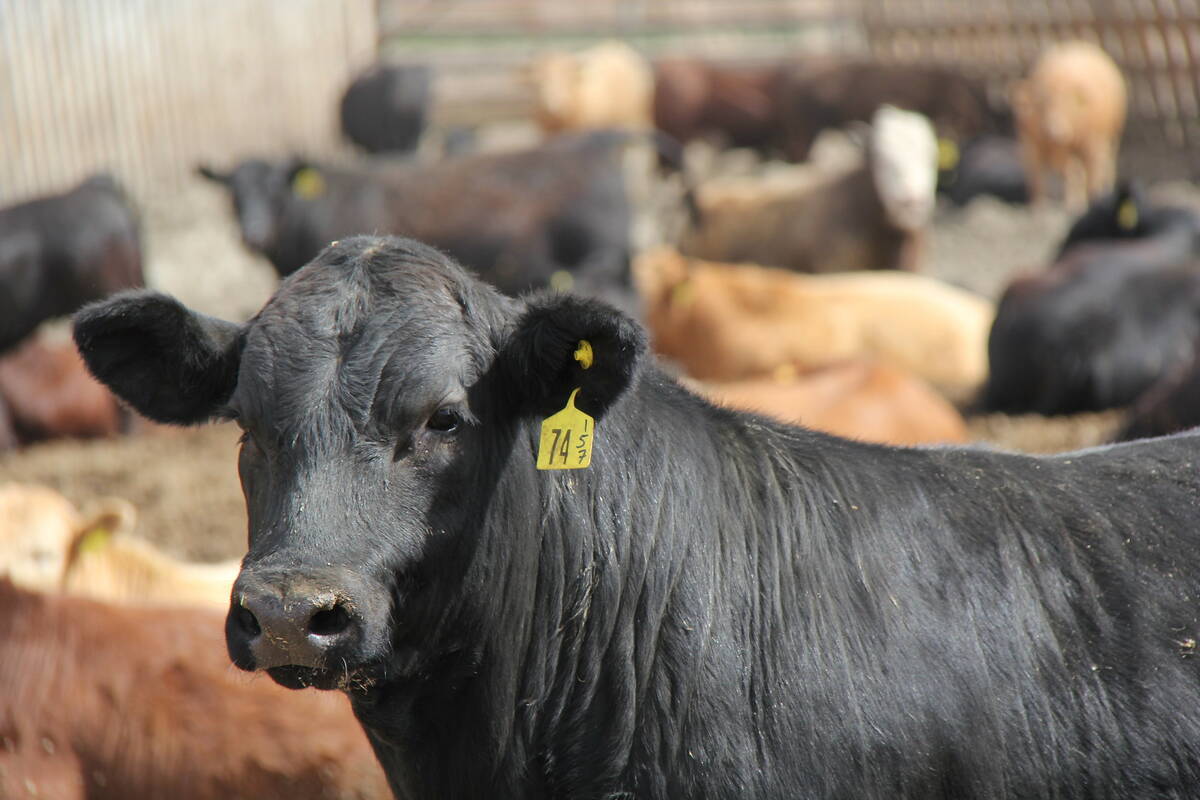
U.S. livestock: Feeder cattle hit record high on tight supply, strong cash prices
Chicago | Reuters – Chicago Mercantile Exchange feeder cattle futures scaled to a record high on Wednesday on strong cash…
The trade expects the report will raise the outlook for U.S. wheat production and stocks.
Watch for our coverage of the USDA report on our Twitter feed and at Producer.com.
The warm weather across the Canadian Prairies is helping to advance crop maturity. Harvest has begun on winter wheat and pulses.
Daytime heating will likely produce some local thunderstorms but the weather should be dry for most of the Prairies until the weekend when temperatures are expected to drop back to more seasonal levels. The temperature shift could bring light rain. The following week looks fairly dry across the Prairies and that should help to advance harvest activity.
The big news of the day was China’s decision to reduce its currency value by nearly two percent to spark is flagging export sector.
A weaker yuan will make it more expensive for China to import commodities such as crops, oil and minerals.
China had previously been supportive of a stronger yuan to foster its use as an international currency, but that had hurt its low-end manufacturers of low-end export goods, Reuters reported. China want to build up its domestic market and reduce reliance on cheap exports but over the weekend data showed a huge slump in July exports that Beijing could not ignore.
Analysts will be watching to see if other Asian countries allow their currencies to fall to match the drop in the yuan.
Light crude oil nearby futures in New York were down $1.88 to US$43.08 per barrel.
The Canadian dollar at noon was US76.06 cents, down from 76.59 cents the previous trading day. The U.S. dollar at noon was C$1.3148.
In unofficial tallies:
The Toronto Stock Exchange composite fell 51.72 points of 0.36 percent to close at 14,414.67.
The Dow Jones industrial average fell 212.19 points, or 1.2 percent, to 17,402.98, the S&P 500 lost 20.07 points, or 0.95 percent, to 2,084.11 and the Nasdaq Composite dropped 65.01 points, or 1.27 percent, to 5,036.79
Winnipeg ICE Futures Canada dollars per tonne
Canola Nov 2015 507.60 -3.80 -0.74%
Canola Jan 2016 506.50 -3.80 -0.74%
Canola Mar 2016 505.40 -3.40 -0.67%
Canola May 2016 501.40 -2.90 -0.58%
Canola Jul 2016 496.40 -2.80 -0.56%
Milling Wheat Oct 2015 224.00 +2.00 +0.90%
Milling Wheat Dec 2015 224.00 +2.00 +0.90%
Milling Wheat Mar 2016 228.00 +2.00 +0.88%
Durum Wheat Oct 2015 370.00 unch 0.00%
Durum Wheat Dec 2015 380.00 unch 0.00%
Durum Wheat Mar 2016 395.00 unch 0.00%
Barley Oct 2015 207.10 -1.00 -0.48%
Barley Dec 2015 207.10 -1.00 -0.48%
American crop prices in cents US/bushel, soybean meal in $US/short ton, soy oil in cents US/pound
Chicago
Soybeans Aug 2015 1014 -30.75 -2.94%
Soybeans Sep 2015 981 -27.25 -2.70%
Soybeans Nov 2015 971.5 -23 -2.31%
Soybeans Jan 2016 976 -23.25 -2.33%
Soybeans Mar 2016 970.75 -21.5 -2.17%
Soybeans May 2016 963 -20 -2.03%
Soybean Meal Aug 2015 347.9 -14.6 -4.03%
Soybean Meal Sep 2015 341.7 -11.9 -3.37%
Soybean Meal Oct 2015 334.6 -11.6 -3.35%
Soybean Oil Aug 2015 30.08 -0.33 -1.09%
Soybean Oil Sep 2015 30.16 -0.33 -1.08%
Soybean Oil Oct 2015 30.26 -0.34 -1.11%
Corn Sep 2015 376.5 -13.75 -3.52%
Corn Dec 2015 387.5 -13.5 -3.37%
Corn Mar 2016 398.75 -13.25 -3.22%
Corn May 2016 404.75 -13.25 -3.17%
Corn Jul 2016 409.25 -13 -3.08%
Oats Sep 2015 226.75 -7 -2.99%
Oats Dec 2015 240 -7.75 -3.13%
Oats Mar 2016 251.75 -5.5 -2.14%
Oats May 2016 258.25 -3.75 -1.43%
Oats Jul 2016 259.25 -3.75 -1.43%
Wheat Sep 2015 507.25 -18.25 -3.47%
Wheat Dec 2015 512.25 -17.25 -3.26%
Wheat Mar 2016 519.5 -17.25 -3.21%
Wheat Jul 2016 528 -17.5 -3.21%
Minneapolis
Spring Wheat Sep 2015 519.25 -15 -2.81%
Spring Wheat Dec 2015 535.25 -15.25 -2.77%
Spring Wheat Mar 2016 551.75 -15 -2.65%
Spring Wheat May 2016 563 -15.5 -2.68%
Spring Wheat Jul 2016 573.25 -16 -2.72%
Kansas City
Hard Red Wheat Sep 2015 488 -16.5 -3.27%
Hard Red Wheat Dec 2015 509.5 -16 -3.04%
Hard Red Wheat Mar 2016 523.75 -15.75 -2.92%
Hard Red Wheat May 2016 534 -15.5 -2.82%
Hard Red Wheat Jul 2016 543.5 -15 -2.69%