Canola futures were down about two percent Thursday despite a half cent fall in the loonie.
The huge size of the Canadian crop has given canola independent weakness from the soybean complex.
Soybeans fell 1.5 percent and soy oil was down about one percent today.
January canola closed at $448.10, down $9.80 or 2.14 percent. Most-active March canola also lost $9.80 at $458.60 on volume of 13,809. Adding to the pain, the basis is also widening.
January seems to be in oversold territory with the 14-day Relative Strength Index at 21.59 percent. According to Bar Chart, the next technical support line is at $439.97.
Read Also
USDA tweaks to soybeans, corn numbers
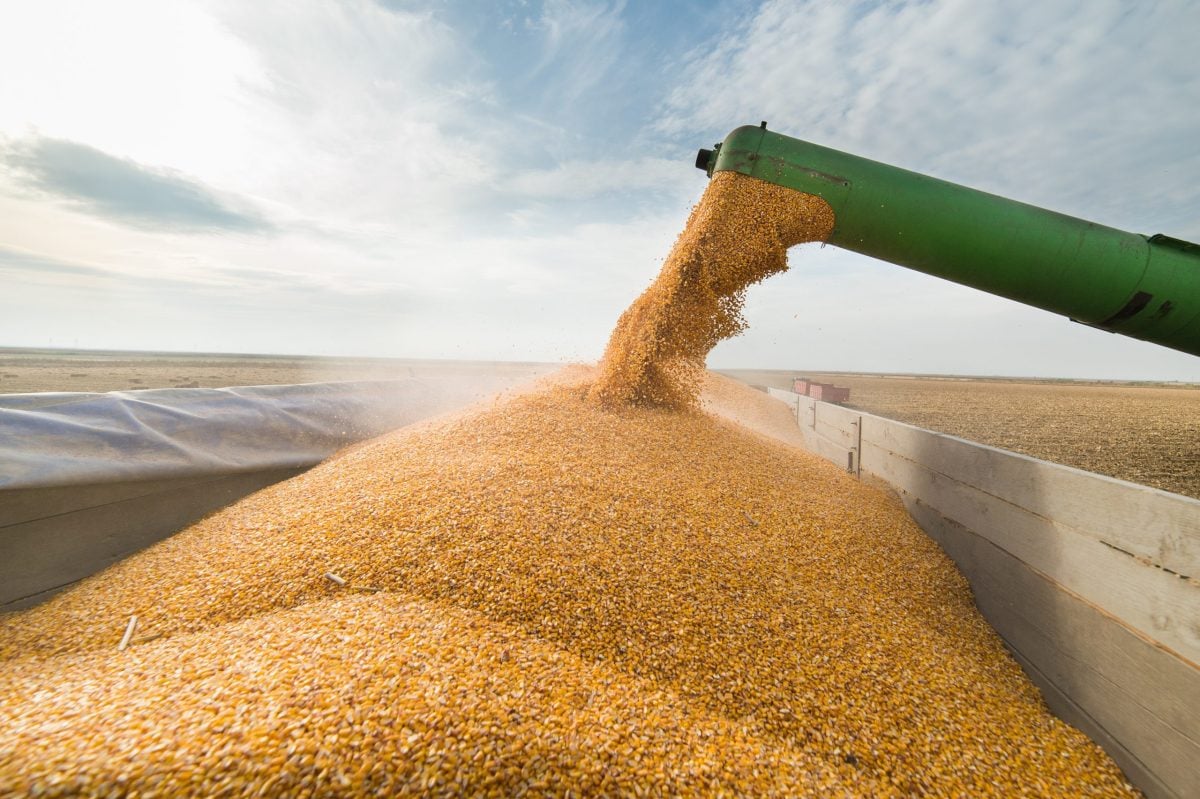
The United States Department of Agriculture is still forecasting a record-large corn crop in 2025/26 despite lowering its average yield projection in the latest World Agricultural Supply and Demand Estimates released Sept. 12
The logistical problems of moving the record large Canadian canola crop, speculative liquidation, farmers selling, worries about a potential slowdown in U.S. soy product sales and the pressure of an expected record large South American soybean crop are all weighing on canola.
Parts of Argentina that needed rain to finish seeding got the moisture in recent days.
Expectations that the U.S. Federal Reserve will taper down its simulative bond buying are also weighing generally on commodities.
About the only positive factor is that the low canola prices are making the crush margin very attractive, which should eventually stimulate demand, although export demand depends on the rail system’s ability to move product.
Similar profitability factors are at work in the U.S. corn ethanol sector increasing production to the best in two years.
All the U.S. wheat exchanges hit contract lows today, on light demand for U.S. supplies on the export market, traders said.
Algeria’s buying agency on Thursday bought about 150,000 tonnes of optional-origin durum wheat, likely from Canada, for $405 a tonne cost and freight, Reuters reported.
U.S. export sales of wheat for the previous week were in line with forecasts but that was considered anemic.
It appears that most of the U.S. winter wheat belt has a blanket of snow protecting the plants from the severe cold.
Corn fell on worries about access to China and on a move by a bipartisan group of U.S. senators to axe the ethanol mandate arguing it inflates the cost of food and feed and is a net drain on the environment.
Reuters reported China has blocked entry of another U.S. corn cargo, and three more may be turned away, after tests found a strain of unapproved genetically-modified (GMO) corn.
Weekly U.S. corn export sales were within the range of expectations.
Palm oil was down on concerns about reduced demand but losses were limited by continuing issue of excess monsoon rain.
Equity markets were down Thursday on expectations that the Fed has room to start cutting its stimulus activities, now that the U.S. economy appears to be picking up steam. With stock markets up so much this year, partly as a result of the Fed’s easy money policy, some traders think it is time to take profits.
Winnipeg ICE Futures Canada dollars per tonne
Canola Jan 2014 448.10 -9.80 -2.14%
Canola Mar 2014 458.60 -9.80 -2.09%
Canola May 2014 467.80 -10.30 -2.15%
Canola Jul 2014 475.50 -10.60 -2.18%
Canola Nov 2014 486.80 -10.40 -2.09%
Milling Wheat Dec 2013 192.00 -2.00 -1.03%
Milling Wheat Mar 2014 202.00 -2.00 -0.98%
Milling Wheat May 2014 212.00 -1.00 -0.47%
Durum Wheat Dec 2013 243.00 unch 0.00%
Durum Wheat Mar 2014 249.00 unch 0.00%
Durum Wheat May 2014 253.00 unch 0.00%
Barley Dec 2013 155.00 +3.00 +1.97%
Barley Mar 2014 157.00 +3.00 +1.95%
Barley May 2014 158.00 +3.00 +1.94%
American crop prices in cents US/bushel, soybean meal in $US/short ton, soy oil in cents US/pound
Chicago
Soybeans Jan 2014 1323.75 -20.25 -1.51%
Soybeans Mar 2014 1311.5 -17 -1.28%
Soybeans May 2014 1295 -14.25 -1.09%
Soybeans Jul 2014 1283.25 -13.5 -1.04%
Soybeans Aug 2014 1254 -11.75 -0.93%
Soybeans Sep 2014 1198.25 -9 -0.75%
Soybean Meal Dec 2013 459.4 -5.2 -1.12%
Soybean Meal Jan 2014 430.1 -8.8 -2.01%
Soybean Meal Mar 2014 421.5 -6.8 -1.59%
Soybean Oil Dec 2013 39.8 -0.4 -1.00%
Soybean Oil Jan 2014 39.99 -0.41 -1.01%
Soybean Oil Mar 2014 40.37 -0.42 -1.03%
Corn Dec 2013 428.25 -3 -0.70%
Corn Mar 2014 434.25 -5 -1.14%
Corn May 2014 442.5 -5.25 -1.17%
Corn Jul 2014 449.25 -5.25 -1.16%
Corn Sep 2014 455 -5.5 -1.19%
Oats Dec 2013 386.5 +6.75 +1.78%
Oats Mar 2014 351.75 +6.75 +1.96%
Oats May 2014 334.75 +5.75 +1.75%
Oats Jul 2014 332.75 +6 +1.84%
Oats Sep 2014 333 +6 +1.83%
Wheat Dec 2013 622.5 -7.75 -1.23%
Wheat Mar 2014 633.75 -7 -1.09%
Wheat May 2014 640.25 -6.5 -1.01%
Wheat Jul 2014 642.25 -4.25 -0.66%
Wheat Sep 2014 651.75 -4.25 -0.65%
Minneapolis
Spring Wheat Dec 2013 652.25 -6.25 -0.95%
Spring Wheat Mar 2014 664 -4.5 -0.67%
Spring Wheat May 2014 674.75 -4.75 -0.70%
Spring Wheat Jul 2014 684.75 -3 -0.44%
Spring Wheat Sep 2014 694.25 -3.25 -0.47%
Kansas City
KCBT Red Wheat Dec 2013 669.25 -27.25 -3.91%
KCBT Red Wheat Mar 2014 678.25 -6.5 -0.95%
KCBT Red Wheat May 2014 682 -5.75 -0.84%
KCBT Red Wheat Jul 2014 679.75 -3.75 -0.55%
KCBT Red Wheat Sep 2014 689.75 -3.75 -0.54%
Light crude oil nearby futures in New York rose 6 cents at $97.50 US per barrel.
The prospect of the Fed tapering, which would lead to higher U.S. interest rates, caused the U.S. dollar to rise against most major currencies.
The Canadian dollar at noon was 93.98 cents US, down from 94.28 cents the previous trading day. The U.S. dollar at noon was $1.0641 Cdn.