Crop futures were up across the board Monday, but canola continued its weak performance, lagging the rest of the market.
Cereal grain contracts were all up by more than one percent, but soybeans only gained about half as much and canola was weaker than soy products.
“Canola is very, very cheap compared to the soy markets,” said Ken Ball of P.I. Financial in Winnipeg.
“At some point, canola’s going to have to become relatively more expensive.”
However, the transition might not go the way that canola growers would like. Ball thinks that continued OK weather for U.S. soybeans would lead to a selloff in the crop. Corn and wheat have already weakened in recent weeks, but soybeans have held up much better.
Read Also
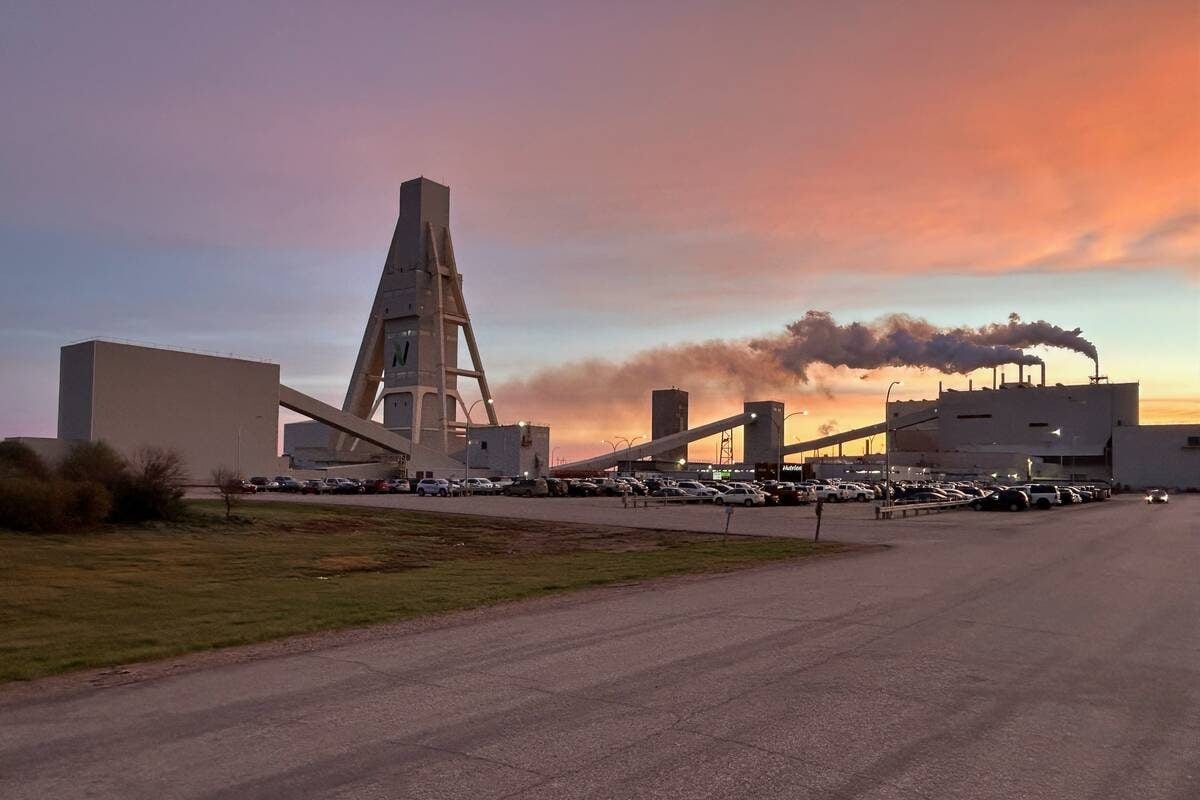
Nutrien tops profit estimates, launches review of phosphate business
Nutrien beat analysts’ expectations for third-quarter profit on Wednesday, and said it would initiate a review of strategic alternatives for its phosphate business.
Western Canada appears to have a big canola crop coming, but at the present relative cheapness, even a big crop won’t be enough to keep up with demand.
“We can’t have demand grow to 19 million tonnes,” said Ball.
“Even with a big, big crop we’re going to run out of canola.”
That means canola at some point will have to gain ground on soybeans, but that might come with lower soybean prices rather than higher canola prices.
Futures markets are in the midst of the summer weather market, with crop yield potential still in play.
Hot and dry weather in parts of the U.S. have made those markets peppy, although the amount of stress on the crop is not seen as serious.
Contact ed.white@producer.com
After the CBOT close, the U.S. Department of Agriculture rated 76 percent of the corn crop as good to excellent, unchanged from a week earlier, Reuters reported. Analysts surveyed by Reuters ahead of the report had expected a slight decline. For soybeans, the USDA rated 71 percent of the crop as good to excellent, unchanged from the previous week and in line with trade expectations.
The USDA said 76 percent of the winter wheat crop was harvested, ahead of the five year average pace of 73 percent.
Light crude oil nearby futures in New York were down 71 cents to US$45.24 per barrel.
The Canadian dollar at noon was US77.02 cents, down from 77.07 cents the previous trading day. The U.S. dollar at noon was C$1.2984.
The Dow Jones industrial average rose 16.5 points, or 0.09 percent, to 18,533.05, for its seventh consecutive up day. The S&P 500 gained 5.15 points, or 0.24 percent, to 2,166.89 and the Nasdaq Composite added 26.20 points, or 0.52 percent, to 5,055.78.
Winnipeg ICE Futures Canada dollars per tonne
Canola Nov 2016 470.70 +0.70 +0.15%
Canola Jan 2017 478.40 +0.50 +0.10%
Canola Mar 2017 485.50 +0.90 +0.19%
Canola May 2017 489.40 +0.60 +0.12%
Canola Jul 2017 493.60 +0.60 +0.12%
Milling Wheat Oct 2016 209.00 unch 0.00%
Milling Wheat Dec 2016 213.00 unch 0.00%
Durum Wheat Oct 2016 271.00 unch 0.00%
Barley Oct 2016 150.00 -5.00 -3.22%
Barley Dec 2016 150.00 -5.00 3.22%
American crop prices in cents US/bushel, soybean meal in $US/short ton, soy oil in cents US/pound
Chicago
Soybeans Aug 2016 1078.25 +7.00 +0.65%
Soybeans Sep 2016 1075.00 +10.75 +1.01%
Soybeans Nov 2016 1066.25 +10.25 +0.97%
Soybeans Jan 2017 1065.00 +10.75 +1.02%
Soybeans Mar 2017 1049.00 +11.50 +1.11%
Soybeans May 2017 1043.25 +11.50 +1.11%
Soybean Meal Aug 2016 373.00 +4.10 +1.11%
Soybean Meal Sep 2016 372.20 +4.60 +1.25%
Soybean Meal Oct 2016 370.80 +4.40 +1.20%
Soybean Oil Aug 2016 30.94 +0.10 +0.32%
Soybean Oil Sep 2016 31.06 +0.09 +0.29%
Soybean Oil Oct 2016 31.18 +0.07 +0.23%
Corn Sep 2016 357.00 +4.75 +1.35%
Corn Dec 2016 363.25 +5.00 +1.40%
Corn Mar 2017 371.75 +5.50 +1.50%
Corn May 2017 376.50 +5.50 +1.48%
Corn Jul 2017 380.25 +5.75 +1.54%
Oats Sep 2016 207.00 +1.00 +0.49%
Oats Dec 2016 204.75 -0.75 -0.36%
Oats Mar 2017 211.75 -1.00 -0.47%
Oats May 2017 216.25 +0.50 +0.23%
Oats Jul 2017 222.00 +0.50 +0.23%
Wheat Sep 2016 429.50 +4.00 +0.94%
Wheat Dec 2016 454.50 +3.75 +0.83%
Wheat Mar 2017 477.75 +4.25 +0.90%
Wheat May 2017 492.00 +4.50 +0.92%
Wheat Jul 2017 502.00 +5.75 +1.16%
Minneapolis
Spring Wheat Sep 2016 498.00 +0.75 +0.15%
Spring Wheat Dec 2016 513.75 +1.00 +0.20%
Spring Wheat Mar 2017 529.50 +2.50 +0.47%
Spring Wheat Jul 2017 548.25 +2.50 +0.46%
Kansas City
Hard Red Wheat Sep 2016 420.00 +5.75 +1.39%
Hard Red Wheat Dec 2016 446.00 +6.50 +1.48%
Hard Red Wheat Mar 2017 463.25 +6.75 +1.48%
Hard Red Wheat May 2017 474.25 +4.00 +0.85%
Hard Red Wheat Jul 2017 484.00 +3.50 +0.73%
Chicago livestock futures in US¢/pound
Live Cattle (P) Aug 2016 112.45 +1.53 +1.38%
Live Cattle (P) Oct 2016 110.62 +0.75 +0.68%
Live Cattle (P) Dec 2016 112.02 +0.60 +0.54%
Feeder Cattle (P) Aug 2016 141.18 +1.80 +1.29%
Feeder Cattle (P) Sep 2016 140.20 +2.08 +1.51%
Feeder Cattle (P) Oct 2016 139.18 +2.08 +1.52%
Lean Hogs (P) Aug 2016 77.82 -0.16 -0.21%
Lean Hogs (P) Oct 2016 65.38 -0.54 -0.82%
Lean Hogs (P) Dec 2016 59.30 -0.18 -0.30%