Crop prices were generally lower Monday as weekend rain in Argentina reduced worries about early crop damage in that country.
More rain is in the forecast.
Oilseeds, including canola, were also pressured by the slow pace of U.S. soybean exports.
Corn and wheat set new contract lows, weighed down by ample supplies.
OUTSIDE MARKETS
Light crude oil nearby futures in New York were up 63 cents at US$57.99 per barrel.
In the afternoon, the Canadian dollar was trading around US77.78 cents, little changed from 77.73 cents the previous trading day. The U.S. dollar was C$1.2857.
Read Also
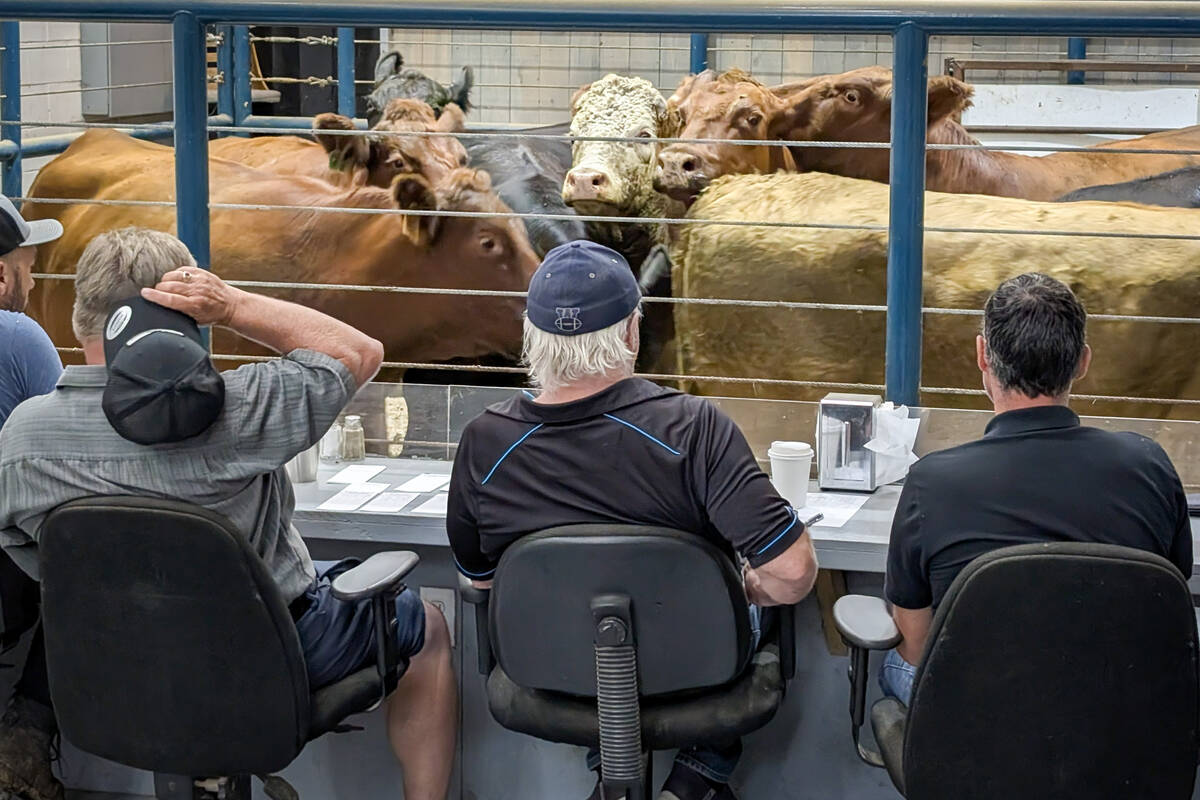
U.S. livestock: Cattle rally, hogs slide
Chicago cattle futures regained a ground on Monday to maintain a fairly level trajectory after last week’s fall.
The Toronto Stock Exchange’s S&P/TSX composite index closed up 7.44 points, or 0.05 percent, at 16,103.51.
The Dow Jones Industrial Average rose 56.87 points, or 0.23 percent, to 24,386.03, the S&P 500 gained 8.49 points, or 0.32 percent, to 2,659.99 and the Nasdaq Composite added 35.00 points, or 0.51 percent, to 6,875.08.
Winnipeg ICE Futures Canada dollars per tonne.
Canola Jan 18 502.50s -2.60 -0.51%
Canola Mar 18 509.90s -3.70 -0.72%
Canola May 18 516.80s -3.80 -0.73%
Canola Jul 18 520.30s -3.70 -0.71%
Canola Nov 18 503.30s -3.30 -0.65%
American crop prices in cents US/bushel, soybean meal in $US/short ton, soy oil in cents US/pound. Prices are displayed with fractions (2/8, 4/8, and 6/8) instead of decimals. -2 equals .25, -4 equals .50, -6 equals .75. The “s” means it is the settlement.
Chicago
Soybeans Jan 18 982-4s -7-2 -0.73%
Soybeans Mar 18 994-0s -7-4 -0.75%
Soybeans May 18 1005-2s -7-0 -0.69%
Soybeans Jul 18 1014-4s -6-4 -0.64%
Soybeans Aug 18 1015-6s -6-2 -0.61%
Soybean Meal Dec 17 326.0s -4.0 -1.21%
Soybean Meal Jan 18 327.7s -4.0 -1.21%
Soybean Meal Mar 18 331.8s -3.9 -1.16%
Soybean Oil Dec 17 33.40s -0.14 -0.42%
Soybean Oil Jan 18 33.46s -0.16 -0.48%
Soybean Oil Mar 18 33.61s -0.18 -0.53%
Corn Dec 17 336-4s -3-4 -1.03%
Corn Mar 18 349-0s -3-6 -1.06%
Corn May 18 357-2s -3-6 -1.04%
Corn Jul 18 365-6s -3-4 -0.95%
Corn Sep 18 373-0s -3-4 -0.93%
Oats Dec 17 227-4s +1-2 +0.55%
Oats Mar 18 243-6s +1-6 +0.72%
Oats May 18 250-2s +2-0 +0.81%
Oats Jul 18 257-4s +1-2 +0.49%
Oats Sep 18 259-4s +3-4 +1.37%
Wheat Dec 17 387-6s -4-2 -1.08%
Wheat Mar 18 413-4s -5-4 -1.31%
Wheat May 18 427-2s -5-0 -1.16%
Wheat Jul 18 441-4s -4-2 -0.95%
Wheat Sep 18 456-0s -3-6 -0.82%
Minneapolis
Spring Wheat Dec 17 596-6s -1-0 -0.17%
Spring Wheat Mar 18 608-6s -2-4 -0.41%
Spring Wheat May 18 617-2s -2-4 -0.40%
Spring Wheat Jul 18 621-6s -2-2 -0.36%
Spring Wheat Sep 18 619-0s -2-2 -0.36%
Kansas City
Hard Red Wheat Dec 17 395-2s -5-4 -1.37%
Hard Red Wheat Mar 18 412-6s -5-2 -1.26%
Hard Red Wheat May 18 426-0s -5-0 -1.16%
Hard Red Wheat Jul 18 442-4s -4-4 -1.01%
Hard Red Wheat Sep 18 458-0s -4-4 -0.97%
Chicago livestock futures in US¢/pound, Pit trade
Live Cattle Dec 17 115.175s -0.400 -0.35%
Live Cattle Feb 18 117.725s -0.575 -0.49%
Live Cattle Apr 18 119.625s -0.575 -0.48%
Feeder Cattle Jan 18 145.450s +0.225 +0.15%
Feeder Cattle Mar 18 143.325s unch unch
Feeder Cattle Apr 18 143.450s -0.200 -0.14%
Lean Hogs Dec 17 63.600s -0.075 -0.12%
Lean Hogs Feb 18 67.025s -1.825 -2.65%
Lean Hogs Apr 18 71.825s -1.300 -1.78%