Crop futures, including canola, drifted a little lower on Wednesday.
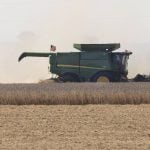
Weather remains mostly dry, hot and windy in Western Canada. Harvest should be making good progress.
The heavy rain from Tropical Storm Harvey is not expected to make it into the U.S. Midwest or southern Plains. The Midwest is enjoying mild weather.
As it moves northeast, the storm’s rain might affect the lower Mississippi, which could temporarily interfer with shipping and grain exports.
Statistics Canada is set to release its first survey on 2017 crop production early Thursday morning. Turn to Producer.com to get the numbers once they are out.
Read Also

Trump quadrupling Argentina beef tariff rate quota to 80,000 tonnes
U.S. President Donald Trump’s administration is quadrupling the tariff rate quota on Argentinian beef to 80,000 tonnes to reduce prices and protect American farmers, a White House official said on Thursday.
The Midwest is expected to see cooler than normal weather next week, but the frost threat is limited.
The Canadian dollar today saw its biggest decline in a month.
Lower oil prices weakened the loonie. Also, speculators scaled back bullish bets on the loonie ahead of the Bank of Canada interest rate decision next Wednesday.
Most of the trade believes the next rate increase will not come until October.
OUTSIDE MARKETS
Light crude oil nearby futures in New York were down 48 cents US$45.96 per barrel.
In the afternoon, the Canadian dollar was trading around US79.22 cents, down from 79.81 cents the previous trading day. The U.S. dollar was C$1.2623.
U.S. Gross domestic product was revised higher to show a three percent annual growth rate in the second quarter.
The Toronto Stock Exchange’s S&P/TSX composite index rose 50.43 points, or 0.33 percent, to 15,133.13.
The Dow Jones Industrial Average rose 27.06 points, or 0.12 percent, to end at 21,892.43, the S&P 500 gained 11.29 points, or 0.46 percent, to 2,457.59 and the Nasdaq Composite added 66.42 points, or 1.05 percent, to 6,368.31.
Winnipeg ICE Futures Canada dollars per tonne
Canola Nov 17 498.10s -0.70 -0.14%
Canola Jan 18 503.80s -1.70 -0.34%
Canola Mar 18 509.50s -1.80 -0.35%
Canola May 18 512.40s -1.70 -0.33%
Canola Jul 18 513.80s -1.50 -0.29%
Milling Wheat Oct 17 243.00s -2.00 -0.82%
Milling Wheat Dec 17 246.00s -2.00 -0.81%
Milling Wheat Mar 18 255.00s -1.00 -0.39%
Durum Wheat Oct 17 298.00s -1.00 -0.33%
Durum Wheat Dec 17 299.00s -1.00 -0.33%
Durum Wheat Mar 18 304.00s -1.00 -0.33%
Barley Oct 17 145.00s unch unch
Barley Dec 17 148.00s unch unch
Barley Mar 18 151.00s unch unch
American crop prices in cents US/bushel, soybean meal in $US/short ton, soy oil in cents US/pound. Prices are displayed with fractions (2/8, 4/8, and 6/8) instead of decimals. -2 equals .25, -4 equals .50, -6 equals .75. The “s” means it is the settlement.
Chicago
Soybeans Sep 17 923-0s -7-6 -0.83%
Soybeans Nov 17 933-2s -4-0 -0.43%
Soybeans Jan 18 942-6s -3-6 -0.40%
Soybeans Mar 18 952-2s -3-2 -0.34%
Soybeans May 18 960-6s -3-0 -0.31%
Soybean Meal Sep 17 292.4s -2.2 -0.75%
Soybean Meal Oct 17 294.6s -2.0 -0.67%
Soybean Meal Dec 17 297.4s -1.8 -0.60%
Soybean Oil Sep 17 34.33s +0.05 +0.15%
Soybean Oil Oct 17 34.44s +0.04 +0.12%
Soybean Oil Dec 17 34.69s +0.04 +0.12%
Corn Sep 17 329-4s -4-0 -1.20%
Corn Dec 17 345-4s -3-2 -0.93%
Corn Mar 18 358-2s -3-2 -0.90%
Corn May 18 365-6s -3-2 -0.88%
Corn Jul 18 372-2s -3-4 -0.93%
Oats Sep 17 228-2s -6-6 -2.87%
Oats Dec 17 243-2s -3-2 -1.32%
Oats Mar 18 249-0s -3-0 -1.19%
Oats May 18 247-6s -3-2 -1.29%
Oats Jul 18 242-4s -1-6 -0.72%
Wheat Sep 17 403-4s +0-6 +0.19%
Wheat Dec 17 429-6s unch unch
Wheat Mar 18 452-6s -0-6 -0.17%
Wheat May 18 466-0s -1-4 -0.32%
Wheat Jul 18 478-4s -1-4 -0.31%
Minneapolis
Spring Wheat Sep 17 633-2s -4-2 -0.67%
Spring Wheat Dec 17 655-6s -4-4 -0.68%
Spring Wheat Mar 18 664-4s -3-0 -0.45%
Spring Wheat May 18 660-0s -2-6 -0.41%
Spring Wheat Jul 18 653-2s -2-0 -0.31%
Kansas City
Hard Red Wheat Sep 17 400-2s +3-0 +0.76%
Hard Red Wheat Dec 17 429-2s +3-0 +0.70%
Hard Red Wheat Mar 18 447-4s +3-0 +0.67%
Hard Red Wheat May 18 461-6s +3-0 +0.65%
Hard Red Wheat Jul 18 479-4s +2-6 +0.58%
Chicago livestock futures in US¢/pound, Pit trade
Live Cattle Aug 17 105.550s +0.300 +0.29%
Live Cattle Oct 17 106.125s +0.025 +0.02%
Live Cattle Dec 17 109.350s +0.175 +0.16%
Feeder Cattle Aug 17 142.900s +0.300 +0.21%
Feeder Cattle Sep 17 143.750s +0.725 +0.51%
Feeder Cattle Oct 17 144.125s +0.600 +0.42%
Lean Hogs Oct 17 61.350s +1.125 +1.87%
Lean Hogs Dec 17 57.200s +1.050 +1.87%
Lean Hogs Feb 18 61.750s +0.850 +1.40%