In a reversal of recent market action canola and spring wheat settled a little lower on Wednesday but corn and soybeans rallied.
The markets are bouncing around with each updated weather forecast for the Midwest, both for moisture and for heat.
The heat in the Midwest was in the forefront today. There is rain in the seven day forecast for the upper Midwest but the big accumulations appear to be missing in western Iowa and Nebraska.
Investment funds were net buyers of corn and soybean futures and net sellers of wheat futures, traders told Reuters.
Read Also
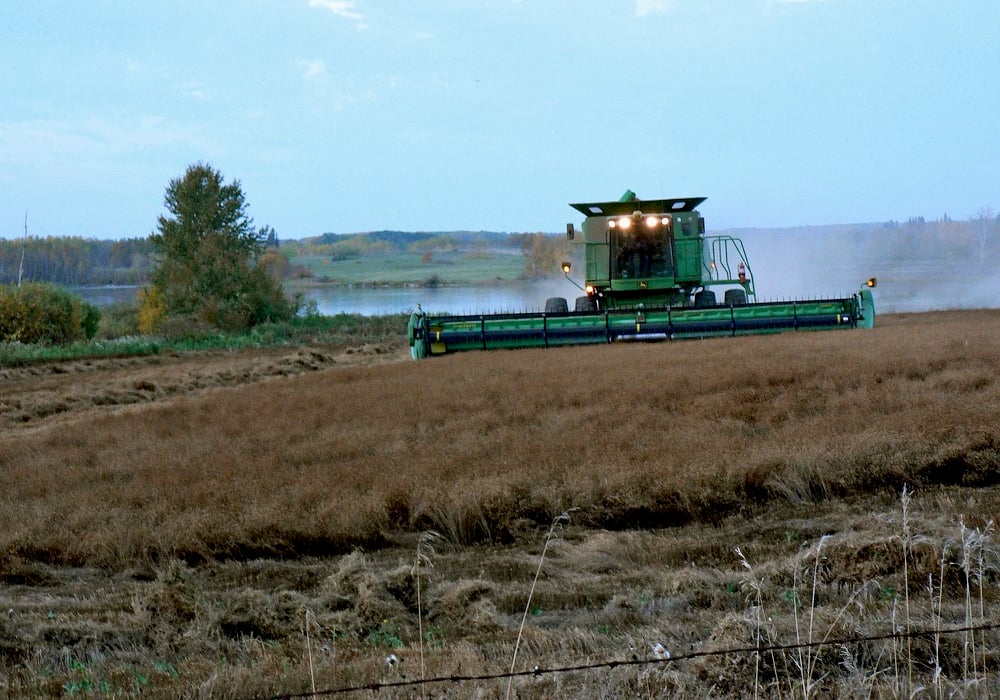
Most of Manitoba harvest wraps up for 2025
Manitoba Agriculture issued its final crop report of 2025, showing the overall provincewide harvest at 97 per cent complete as of Oct. 20. Nearly all major crops have finished combining, with 37 per cent of Manitoba’s sunflowers finished, plus 71 per cent of grain corn and small amounts of soybeans and potatoes left to do.
The loonie continued to rally above US79 cents, limiting the upside of the canola market.
The recent cooler weather on the Prairies, along with scattered showers could help canola conditions in some areas. Also, previous Prairie forecasts that showed many days in the high 20s C and low 30s are now shifting to a more varied outlook with more days with highs only in the mid to low 20s.
There could be unsettled weather on Friday in central and eastern Saskatchewan as well as Manitoba, raising the potential for thundershowers.
However, today’s U.S. weather service’s seven-day forecast showed a drier outlook for eastern Saskatchewan than the Tuesday forecast. The map still shows rain in Manitoba later this week.
OUTSIDE MARKETS
Light crude oil nearby futures in New York were up 72 cents at US$47.12 per barrel.
In the afternoon, the Canadian dollar was trading around US79.38 cents, up from 79.22 cents the previous trading day. The U.S. dollar was C$1.2598.
The Toronto Stock Exchange’s S&P/TSX composite index rose 95.14 points, or 0.63 percent, to finish at 15,244.71.
American stock indexes reached new record highs.
The Dow Jones Industrial Average rose 66.02 points, or 0.31 percent, to 21,640.75, the S&P 500 gained 13.22 points, or 0.54 percent, to 2,473.83 and the Nasdaq Composite added 40.74 points, or 0.64 percent, to 6,385.04.
Winnipeg ICE Futures Canada dollars per tonne
Canola Nov 2017 507.50 -3.00 -0.59%
Canola Jan 2018 511.90 -2.80 -0.54%
Canola Mar 2018 514.90 -2.90 -0.56%
Canola May 2018 514.00 -3.40 -0.66%
Canola Jul 2018 514.50 -2.80 -0.54%
Milling Wheat Oct 2017 293.00 -2.00 -0.68%
Milling Wheat Dec 2017 301.00 -1.00 -0.33%
Milling Wheat Mar 2018 304.00 -2.00 -0.65%
Durum Wheat Oct 2017 284.00 unch 0.00%
Durum Wheat Dec 2017 286.00 unch 0.00%
Durum Wheat Mar 2018 287.00 unch 0.00%
Barley Oct 2017 140.00 unch 0.00%
Barley Dec 2017 140.00 unch 0.00%
Barley Mar 2018 140.00 unch 0.00%
American crop prices in cents US/bushel, soybean meal in $US/short ton, soy oil in cents US/pound
Chicago
Soybeans Aug 2017 999.75 +9.75 +0.98%
Soybeans Sep 2017 1004.00 +9.50 +0.96%
Soybeans Nov 2017 1012.50 +10.25 +1.02%
Soybeans Jan 2018 1021.00 +10.00 +0.99%
Soybeans Mar 2018 1023.00 +10.25 +1.01%
Soybeans May 2018 1025.75 +10.00 +0.98%
Soybean Meal Aug 2017 326.60 +2.60 +0.80%
Soybean Meal Sep 2017 328.70 +2.70 +0.83%
Soybean Meal Oct 2017 330.60 +2.70 +0.82%
Soybean Oil Aug 2017 33.46 +0.30 +0.90%
Soybean Oil Sep 2017 33.58 +0.33 +0.99%
Soybean Oil Oct 2017 33.67 +0.27 +0.81%
Corn Sep 2017 382.50 +6.25 +1.66%
Corn Dec 2017 396.25 +6.00 +1.54%
Corn Mar 2018 407.00 +6.00 +1.50%
Corn May 2018 412.25 +6.25 +1.54%
Corn Jul 2018 417.00 +6.00 +1.46%
Oats Sep 2017 293.00 +0.75 +0.26%
Oats Dec 2017 294.00 +2.00 +0.68%
Oats Mar 2018 292.25 +2.50 +0.86%
Oats May 2018 291.25 +2.50 +0.87%
Oats Jul 2018 290.00 +2.50 +0.87%
Wheat Sep 2017 503.00 +0.50 +0.10%
Wheat Dec 2017 526.75 +1.50 +0.29%
Wheat Mar 2018 546.50 +2.25 +0.41%
Wheat May 2018 557.00 +2.00 +0.36%
Wheat Jul 2018 561.75 +1.75 +0.31%
Minneapolis
Spring Wheat Sep 2017 775.50 -5.00 -0.64%
Spring Wheat Dec 2017 779.50 -3.75 -0.48%
Spring Wheat Mar 2018 773.00 -3.50 -0.45%
Spring Wheat May 2018 760.00 -3.25 -0.43%
Spring Wheat Jul 2018 741.75 -3.50 -0.47%
Kansas City
Hard Red Wheat Sep 2017 500.25 -1.00 -0.20%
Hard Red Wheat Dec 2017 526.75 -1.00 -0.19%
Hard Red Wheat Mar 2018 543.50 -0.75 -0.14%
Hard Red Wheat May 2018 556.50 -2.00 -0.36%
Hard Red Wheat Jul 2018 567.00 -0.75 -0.13%
Chicago livestock futures in US¢/pound (rounded to two decimal places)
Live Cattle (P) Aug 2017 117.28 +2.38 +2.07%
Live Cattle (P) Oct 2017 118.88 +2.11 +1.81%
Live Cattle (P) Dec 2017 119.68 +2.20 +1.87%
Feeder Cattle (P) Aug 2017 154.50 +3.35 +2.22%
Feeder Cattle (P) Sep 2017 154.45 +3.25 +2.15%
Feeder Cattle (P) Oct 2017 152.95 +3.02 +2.01%
Lean Hogs (P) Aug 2017 82.58 +2.02 +2.51%
Lean Hogs (P) Oct 2017 68.80 +0.92 +1.36%
Lean Hogs (P) Dec 2017 62.95 +0.30 +0.48%