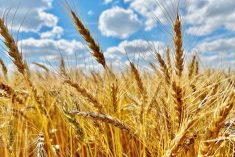
Kansas hard red winter wheat, battered by a weekend blizzard, hung on to close up two cents in the July contract but otherwise U.S. crop markets gave back a lot of the gains they posted on Monday.
In Canada July canola closed at $520.80 up $5.20 or about on percent.
New crop November closed at $504.80 up $3.60 or 0.72 percent.
Canola had support from stronger soy oil and a weaker Canadian dollar.
Vegetable oil prices were supported by stronger than expected palm export data from Malaysia for April.
Read Also

Canadian agriculture minister MacDonald headed to Mexico
Canadian Minister of Agriculture and Agri-Food, Heath MacDonald, will lead a ministerial mission to Mexico next week, Oct. 14-17.
While Kansas hard red winter edged a little higher, after climbing almost limit up on Monday, Minneapolis hard red spring wheat fell, giving back most of Monday’s gains.
There is a belief that the winter wheat crop might bounce back or that damage will not be so large as to have a major impact on global wheat surplus. Also a lot of the momentum for gains on Monday came from the fact that funds had a record net short position in wheat.
Corn and soybeans also gave back Monday’s gains.
U.S. CROP PROGRESS SURPRISINGLY GOOD
After the market closed on Monday the USDA weekly crop progress report said that as of Sunday, 34 percent of the corn crop was in the ground, Behind last year’s rapid pace of 43 percent but right in line with the five year average of 34 percent.
Soybean planting rose to 10 percent, which was better than last year’s pace of seven percent and the five-year average of seven percent.
It kept the condition of the winter wheat crop unchanged. The impact of the snow and frost will show up in the following weeks.
Spring wheat planting was lagging at 31 percent complete, compared to 52 percent last year and the five-year average of 46 percent.
PRAIRIE WEATHER
There are scattered showers and thunderstorms today but the rest of the week should be drier and warmer. But the longer term forecast for early next week has an increased potential for rain in the western half of the Prairies.

WHEAT TOUR
The annual Wheat Quality Council tour is visiting the U.S. hard red winter wheat region this week.
On Tuesday morning the tour was in north-central Kansas. Reports indicate that yield prospects were about average but not as good as last year’s record-yielding crop.
The tour had not got to the western region where there was snow.
The tour will issue a final state yield estimate on Thursday.
STATSCAN STOCKS REPORT FRIDAY.
StatsCan will release its March 31 grain stocks report on Friday. Analysts expect canola stocks will be well down from last year at the same time, but wheat stocks will be higher.
OUTSIDE MARKETS
Light crude oil nearby futures in New York were down $1.18 to US$47.66 per barrel. The oil market has now lost all the gains it made early this year when OPEC cut production. The production declines have been offset by increased production in the United States, Canada, Libya and compliance cheating among OPEC members.
In the afternoon, the Canadian dollar was trading around US72.89 cents, down from 73.09 cents the previous trading day. The U.S. dollar was C$1.3719.
The Toronto Stock Exchange composite closed up 43.40 points or 0.28 percent at 15,619.03.
The Dow Jones Industrial Average climbed 9.39 points, or 0.04 percent, to 20,922.85. The S&P 500 dipped 1.08 points, or 0.05 percent, to 2,387.25.
The Nasdaq Composite dropped 5.67 points, or 0.09 percent, to 6,085.93
Winnipeg ICE Futures Canada dollars per tonne
Canola Jul 2017 520.80 +5.20 +1.01%
Canola Nov 2017 504.80 +3.60 +0.72%
Canola Jan 2018 509.60 +3.80 +0.75%
Canola Mar 2018 514.50 +4.20 +0.82%
Canola May 2018 516.60 +4.30 +0.84%
Milling Wheat Jul 2017 244.00 -1.00 -0.41%
Milling Wheat Oct 2017 243.00 +1.00 +0.41%
Milling Wheat Dec 2017 245.00 +1.00 +0.41%
Durum Wheat Jul 2017 273.00 +1.00 +0.37%
Durum Wheat Oct 2017 264.00 unch 0.00%
Durum Wheat Dec 2017 264.00 unch 0.00%
Barley Jul 2017 138.00 unch 0.00%
Barley Oct 2017 140.00 unch 0.00%
Barley Dec 2017 140.00 unch 0.00%
American crop prices in cents US/bushel, soybean meal in $US/short ton, soy oil in cents US/pound
Chicago
Soybeans May 2017 958.00 -1.00 -0.10%
Soybeans Jul 2017 968.75 -1.50 -0.15%
Soybeans Aug 2017 970.25 -1.25 -0.13%
Soybeans Sep 2017 966.25 -0.75 -0.08%
Soybeans Nov 2017 964.75 +0.25 +0.03%
Soybeans Jan 2018 972.00 +0.75 +0.08%
Soybean Meal May 2017 310.80 -3.50 -1.11%
Soybean Meal Jul 2017 315.00 -3.60 -1.13%
Soybean Meal Aug 2017 316.20 -3.30 -1.03%
Soybean Oil May 2017 32.35 +0.46 +1.44%
Soybean Oil Jul 2017 32.62 +0.46 +1.43%
Soybean Oil Aug 2017 32.73 +0.46 +1.43%
Corn May 2017 364.00 -5.25 -1.42%
Corn Jul 2017 372.25 -5.25 -1.39%
Corn Sep 2017 379.75 -5.00 -1.30%
Corn Dec 2017 390.00 -4.50 -1.14%
Corn Mar 2018 399.75 -4.25 -1.05%
Oats May 2017 245.25 +2.00 +0.82%
Oats Jul 2017 241.50 +2.00 +0.84%
Oats Sep 2017 231.00 -0.75 -0.32%
Oats Dec 2017 223.25 -0.25 -0.11%
Oats Mar 2018 226.00 +1.00 +0.44%
Wheat May 2017 441.50 -1.25 -0.28%
Wheat Jul 2017 454.00 -2.00 -0.44%
Wheat Sep 2017 468.00 -0.75 -0.16%
Wheat Dec 2017 489.25 -0.75 -0.15%
Wheat Mar 2018 506.00 -1.00 -0.20%
Minneapolis
Spring Wheat May 2017 543.50 -6.25 -1.14%
Spring Wheat Jul 2017 557.50 -5.25 -0.93%
Spring Wheat Sep 2017 561.50 -6.00 -1.06%
Spring Wheat Dec 2017 567.50 -5.75 -1.00%
Spring Wheat Mar 2018 573.75 -6.75 -1.16%
Kansas City
Hard Red Wheat May 2017 454.75 +2.00 +0.44%
Hard Red Wheat Jul 2017 467.75 +2.00 +0.43%
Hard Red Wheat Sep 2017 482.50 +3.00 +0.63%
Hard Red Wheat Dec 2017 504.25 +2.75 +0.55%
Hard Red Wheat Mar 2018 516.75 +2.50 +0.49%
Chicago livestock futures in US¢/pound (rounded to two decimal places)
Live Cattle (P) Jun 2017 127.05 +2.93 +2.36%
Live Cattle (P) Aug 2017 120.80 +0.63 +0.52%
Live Cattle (P) Oct 2017 117.60 -0.30 -0.25%
Feeder Cattle (P) May 2017 149.62 +1.02 +0.69%
Feeder Cattle (P) Aug 2017 155.60 +1.85 +1.20%
Feeder Cattle (P) Sep 2017 155.32 +1.64 +1.07%
Lean Hogs (P) May 2017 66.95 +0.83 +1.26%
Lean Hogs (P) Jun 2017 74.15 +0.88 +1.20%
Lean Hogs (P) Jul 2017 75.70 +0.83 +1.11%


