Once more crop futures markets showed their resilience in the face of a noticeable stock market selloff, treading water Monday and seeing little excitement.
While prices are guttering along after a months-long selloff, the relative stability of crops futures compared to equity markets came as a relief.
“We definitely are not seeing the same kind of link between all these markets, whereas they used to be all almost totally correlated,” said John Driedger of FarmLink Solutions.
“Right now there’s a bit more attachment to weather and other crop factors.”
Read Also
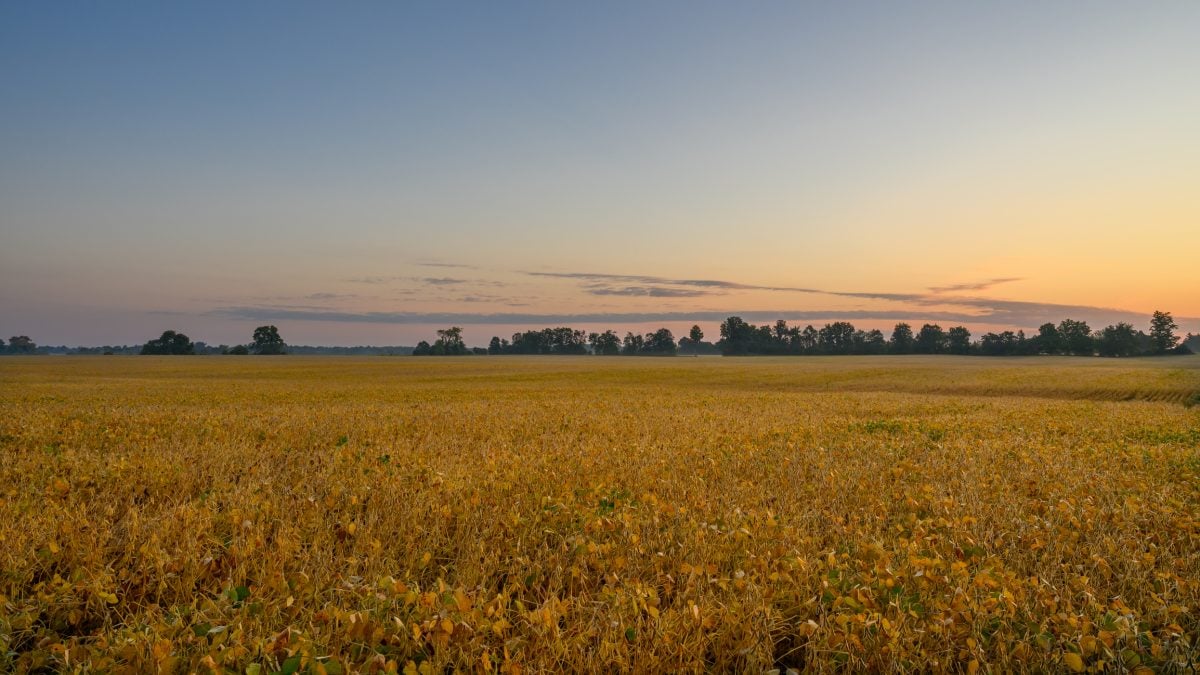
China holds off on soybean purchases due to high Brazil premiums, traders say
China has yet to secure much of its soybean supply for December and January as high premiums for Brazilian cargoes discourage buyers.
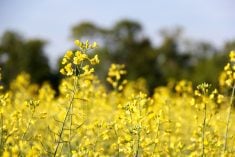
Canola futures were down a few cents to $474.80 per tonne for November and $479.80 for January, while soybeans were up slightly, soybean meal was down slightly, and soybean oil was up slightly.
Crude oil futures rebounded Monday, as did the Canadian dollar. That currency factor explained a lot of the canola weakness.
If anything, the wet weather on the eastern Prairies and immature crops in many areas should be a bullish factor, but over the month of August canola futures fell more than five percent.
Wheat futures rose slightly Monday, with most of the U.S. crop already off.
Stock markets were weaker, with investors fretting about the U.S. Federal Reserve bank raising interest rates. But because this is the last week of summer, no one is treating the market action too seriously. Much attention will be paid to how traders, investors and fund managers this week and next week when legions return from summer holidays and set their minds to the autumn markets. Often September and October see major selloffs, but the late summer selloff might have stolen the bearish momentum, some traders think.
Light crude oil nearby futures in New York were up $3.98 to US$49.20 per barrel.
The Canadian dollar at noon was US75.63 cents, up from 75.36 cents the previous trading day. The U.S. dollar at noon was C$1.3223.
Winnipeg ICE Futures Canada dollars per tonne
Canola Nov 2015 474.80 -2.90 -0.61%
Canola Jan 2016 479.80 -2.30 -0.48%
Canola Mar 2016 484.30 -1.80 -0.37%
Canola May 2016 484.60 -1.30 -0.27%
Canola Jul 2016 484.80 -0.30 -0.06%
Milling Wheat Oct 2015 226.00 +1.00 +0.44%
Milling Wheat Dec 2015 226.00 +1.00 +0.44%
Milling Wheat Mar 2016 230.00 +1.00 +0.44%
Durum Wheat Oct 2015 335.00 unch 0.00%
Durum Wheat Dec 2015 335.00 unch 0.00%
Durum Wheat Mar 2016 340.00 unch 0.00%
Barley Oct 2015 191.90 unch 0.00%
Barley Dec 2015 191.90 unch 0.00%
Barley Mar 2016 193.90 unch 0.00%
American crop prices in cents US/bushel, soybean meal in $US/short ton, soy oil in cents US/pound
Chicago
Soybeans Sep 2015 897.5 +4.25 +0.48%
Soybeans Jan 2016 892.25 +1.5 +0.17%
Soybeans Mar 2016 893.75 +1.5 +0.17%
Soybeans May 2016 896.5 +1.5 +0.17%
Soybeans Jul 2016 900.25 +1.75 +0.19%
Soybean Meal Sep 2015 320.9 -0.5 -0.16%
Soybean Meal Oct 2015 313.6 -1.8 -0.57%
Soybean Meal Dec 2015 311.3 -1.4 -0.45%
Soybean Oil Sep 2015 27.92 +0.13 +0.47%
Soybean Oil Oct 2015 28.03 +0.11 +0.39%
Soybean Oil Dec 2015 28.25 +0.08 +0.28%
Corn Sep 2015 363.75 +0.5 +0.14%
Corn Dec 2015 375.25 +0.25 +0.07%
Corn Mar 2016 386.25 -0.25 -0.06%
Corn May 2016 392.75 -0.25 -0.06%
Corn Jul 2016 397.25 -0.25 -0.06%
Oats Sep 2015 235.5 +1 +0.43%
Oats Dec 2015 230.25 +1.75 +0.77%
Oats Mar 2016 229.75 +1.75 +0.77%
Oats May 2016 235.25 +1.25 +0.53%
Oats Jul 2016 236.25 +1.25 +0.53%
Wheat Sep 2015 482.5 +5.5 +1.15%
Wheat Dec 2015 485 +1.25 +0.26%
Wheat Mar 2016 490.25 -1.5 -0.31%
Wheat May 2016 494.25 -2.75 -0.55%
Wheat Jul 2016 498 -3.25 -0.65%
Minneapolis
Spring Wheat Sep 2015 496.5 +6 +1.22%
Spring Wheat Dec 2015 514.5 +3 +0.59%
Spring Wheat Mar 2016 530.25 +1.25 +0.24%
Spring Wheat May 2016 540.75 +0.25 +0.05%
Spring Wheat Jul 2016 551.25 unch 0.00%
Kansas City
Hard Red Wheat Sep 2015 463.75 +6 +1.31%
Hard Red Wheat Mar 2016 501.75 +4 +0.80%
Hard Red Wheat May 2016 511.5 +3.75 +0.74%
Hard Red Wheat Jul 2016 520.75 +3 +0.58%