 Weakness in the Canadian dollar helped canola futures edge higher Tuesday, fighting against a continued weakness in crop prices.
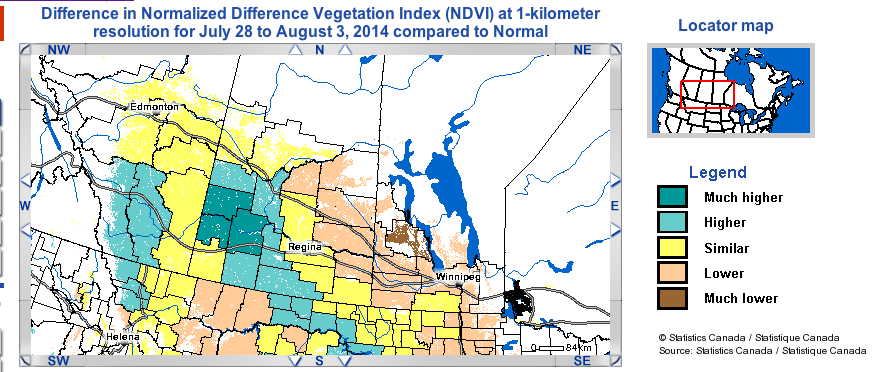
Warm, humid conditions prevailed across the Canadian Prairies with not a lot of rain in the forecast except for isolated thundershowers today in western Saskatchewan.
Read Also
U.S. livestock: Hog futures hit contract highs on shock herd decline
Chicago | Reuters – Lean hog futures stormed to contract highs at the Chicago Mercantile Exchange on Friday as smaller-than-expected…
The heat will advance the crop, but also limit yields. Generally though, the crop looks in better shape now than it did a month ago.
Rain fell in the Midwest over night, mostly in Illinois and Wisconsin. That pressured soybeans and corn lower.
The condition ratings of corn and soybeans remain good, adding to downward pressure on prices.
Wheat futures rose Tuesday.
Reuters reported that Ukraine is the latest European country to suffer rain at harvest. The amount of crop expected to grade feed is expected to rise to about 35 percent, up from 25-30 percent last year.
However, Russia is expected to have a quality crop and analysts’ production forecasts for Russia are increasing.
European futures for milling grade wheat rose today on expectations that rain at harvest will reduce the amount of quality wheat available.
This supported ideas that buyers might have to turn to North America for quality wheat and that lifted U.S. wheat futures today.
The U.S. winter wheat crop is 90 percent harvested, USDA said Monday.
Henan province in China is undergoing its worst drought since the 1960s. It is a major corn producer, growing about 30 percent of the country’s output. Other nearby provinces in central and northern China are also dry. Chinese media report corn futures in the country are rising on the threat presented by the dry weather.
If China does have a poor corn crop, the country can fall back on huge government owned stocks of the grain purchased over the past few years.
French analyst Strategie Grains raised its forecast for the 2014 rapeseed crop in the European Union to a new record of 22.9 million tonnes up 400,000 tonnes from last month.
But in Ukraine the rapeseed crop is expected to fall to 2.05 million tonnes from 2.35 million last year. Most of its crop is exported to the EU.
Western yellow virus is having its biggest year ever in Australia’s canola crop. It is spread by aphids. Tens of 1,000s of acres have been affected.
Grain growing areas of eastern Australia had generally less than normal rainfall in July.
Cash feed barley prices are falling in southern Alberta.
Feed barley, 15 percent moisture, in Lethbridge on average has fallen to $182 per tonne, down from $186 the week ending July 21 and down from $195 the week of July 14, according to data collected by AgValue Brokers and printed at www.canola.ab.ca.
ICE Futures Canada, dollars per tonne
Canola Nov 2014 439.30 +5.00 +1.15%
Canola Jan 2015 444.40 +6.00 +1.37%
Canola Mar 2015 445.30 +6.20 +1.41%
Canola May 2015 441.70 +6.30 +1.45%
Canola Jul 2015 437.30 +6.10 +1.41%
Milling Wheat Oct 2014 194.00 +6.00 +3.19%
Milling Wheat Dec 2014 199.00 +5.00 +2.58%
Milling Wheat Mar 2015 200.00 +4.00 +2.04%
Durum Wheat Oct 2014 250.00 unch 0.00%
Durum Wheat Dec 2014 256.00 unch 0.00%
Durum Wheat Mar 2015 257.00 unch 0.00%
Barley Oct 2014 136.50 unch 0.00%
Barley Dec 2014 138.50 unch 0.00%
Barley Mar 2015 139.50 unch 0.00%
American crop prices in cents US/bushel, soybean meal in $US/short ton, soy oil in cents US/pound
Chicago
Soybeans Aug 2014 1222.75 -9.75 -0.79%
Soybeans Sep 2014 1081.5 -13.75 -1.26%
Soybeans Nov 2014 1065.75 -13.75 -1.27%
Soybeans Jan 2015 1074.25 -13.75 -1.26%
Soybeans Mar 2015 1082.25 -13.5 -1.23%
Soybeans May 2015 1089 -13.75 -1.25%
Soybean Meal Aug 2014 382.2 -6 -1.55%
Soybean Meal Sep 2014 355.7 -5.1 -1.41%
Soybean Meal Oct 2014 346.3 -4.3 -1.23%
Soybean Oil Aug 2014 35.47 -0.55 -1.53%
Soybean Oil Sep 2014 35.57 -0.55 -1.52%
Soybean Oil Oct 2014 35.66 -0.54 -1.49%
Corn Sep 2014 356.25 -2.5 -0.70%
Corn Dec 2014 367.25 -2 -0.54%
Corn Mar 2015 380 -2 -0.52%
Corn May 2015 388.25 -2 -0.51%
Corn Jul 2015 395.25 -2.5 -0.63%
Oats Sep 2014 360 +9 +2.56%
Oats Dec 2014 333 +2.5 +0.76%
Oats Mar 2015 318.75 -0.5 -0.16%
Oats May 2015 309.5 +0.25 +0.08%
Oats Jul 2015 310.75 +1 +0.32%
Wheat Sep 2014 552.5 +8.5 +1.56%
Wheat Dec 2014 572.75 +8.25 +1.46%
Wheat Mar 2015 592.5 +9 +1.54%
Wheat May 2015 604.75 +9 +1.51%
Wheat Jul 2015 611.75 +7.75 +1.28%
Minneapolis
Spring Wheat Sep 2014 629.25 +5.75 +0.92%
Spring Wheat Dec 2014 640.5 +6.25 +0.99%
Spring Wheat Mar 2015 653.5 +6.5 +1.00%
Spring Wheat May 2015 660.5 +5.75 +0.88%
Spring Wheat Jul 2015 667.75 +5.75 +0.87%
Kansas City
Hard Red Wheat Sep 2014 642.75 +4.25 +0.67%
Hard Red Wheat Dec 2014 656 +5.5 +0.85%
Hard Red Wheat Mar 2015 662.5 +6 +0.91%
Hard Red Wheat May 2015 665.5 +5.5 +0.83%
Hard Red Wheat Jul 2015 655.5 +5.5 +0.85%
Light crude oil nearby futures in New York fell 91 cents at $97.38 US per barrel.
The Bank of Canada noon rate for the loonie was 91.16 cents US, down from 91.58 cents the previous trading day. The U.S. dollar at noon was $1.0970 Cdn.
Weak economic data from China and worries about rising tensions in eastern Ukraine pressured stock markets lower. Data from the U.S. was better with services sector activity hitting an 8 ½ year high last month and factory orders surging in June.
In early tallies —
The TSX composite fell 27.55 points or 0.18 percent to 15,187.81.
The Dow Jones industrial average fell 140.13 points, or 0.85 percent, to 16,429.15.
The S&P 500 lost 18.83 points, or 0.97 percent, to 1,920.16.
The Nasdaq Composite dropped 31.05 points, or 0.71 percent, to 4,352.84.