
Canola futures rose on Wednesday, boosted by short-covering and concerns about wet soil conditions as Prairie farmers try to start their planting season.
Technical buying supported the most active July contract, but it was partly offset by farmer selling to commercial buyers.
May canola gained $8.90 to close at $530.40 per tonne, boosted by short-covering ahead of the contract’s expiry next month.
Most-traded July canola rose 40 cents to $521.60 per tonne.
May-July canola spread traded 4,231 times.
New crop November rose $1.40 to close at $496.70.
U.S. MARKETS
U.S. corn futures fell more than one percent Wednesday on forecasts for better Midwest planting weather and news that the White House is considering an executive order on withdrawing from North American Free Trade Agreement, analysts said.
Read Also

Ample supplies and improved livestock sector to boost Canadian feed sector: FCC
Abundant feed grain supplies and improved profitability for the livestock sector should support strong feed demand and sales through the winter, says a new report from Farm Credit Canada.
Soybeans also declined and wheat turned lower as corn sagged.
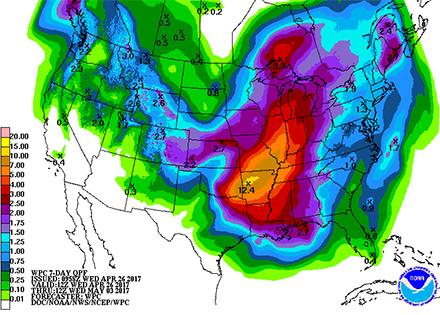
Heavy rain is expected over the next week in U.S. growing areas, especially the southern Midwest and the Delta, which could swamp some soft winter wheat. There is also a bit of concern about cold weather in the southern Plains expected this weekend. It has the potential to nip hard red winter wheat.
But the extended forecast for early May scaled back moisture accumulations easing fears of planting delays and that pressured corn lower.
“It’s the weather that took us lower. The extended forecast beyond the middle of next week went drier and cooler,” said Dan Basse, president of Chicago-based AgResource Co.
NAFTA
Others cited jitters about U.S. corn exports to Mexico, a top buyer, after a senior Trump administration official said a draft executive order to withdraw the United States from NAFTA, a U.S., Mexico and Canada trade pact, is under consideration.
“The possibility of withdrawing from NAFTA is a very scary thing for corn, because we do a lot of export business for corn (to) Mexico,” said Ted Seifried, chief market strategist with the Zaner Group in Chicago.
Mexico is one of the top three markets for U.S. farm production.
BRAZIL CURRENCY AFFECTS SOY MARKET
Soybeans faced additional pressure from weakness in Brazil’s currency, the real, which could prompt Brazilian farmers to sell more of their record-large soybean harvest.
Producers in the South American country have so far been reluctant to sell much of the crop. But a weaker real makes dollar-denominated soybeans worth more to Brazilian producers.
CBOT soyoil futures bucked the weaker trend, drawing support from a new legislative proposal to reinstate a tax credit on soy-based biodiesel fuel.
WHEAT
Wheat turned lower, following the declines in corn and soybeans. But the market was underpinned by worries about chilly weather expected in the southern Plains this weekend that could damage developing winter wheat.
“Colder conditions in the western Plains this weekend may result in some spotty damage to jointing wheat, mainly in far western Kansas, eastern Colorado, and far western Oklahoma,” MDA Weather Services said in a note to clients.
OUTSIDE MARKETS
Light crude oil nearby futures in New York were up six cents to US$49.62 per barrel.
In the afternoon, the Canadian dollar was trading around US73.43 cents, down from 73.71 cents the previous trading day. The U.S. dollar was C$1.3618.
Winnipeg ICE Futures Canada dollars per tonne
Canola May 2017 530.40 +8.90 +1.71%
Canola Jul 2017 521.60 +0.40 +0.08%
Canola Nov 2017 496.70 +1.40 +0.28%
Canola Jan 2018 500.50 +1.70 +0.34%
Canola Mar 2018 504.60 +1.90 +0.38%
Milling Wheat May 2017 232.00 +4.00 +1.75%
Milling Wheat Jul 2017 234.00 +5.00 +2.18%
Milling Wheat Oct 2017 228.00 +5.00 +2.24%
Durum Wheat May 2017 271.00 unch 0.00%
Durum Wheat Jul 2017 272.00 unch 0.00%
Durum Wheat Oct 2017 264.00 unch 0.00%
Barley May 2017 137.00 unch 0.00%
Barley Jul 2017 138.00 unch 0.00%
Barley Oct 2017 140.00 unch 0.00%
American crop prices in cents US/bushel, soybean meal in $US/short ton, soy oil in cents US/pound
Chicago
Soybeans May 2017 945.75 -8.75 -0.92%
Soybeans Jul 2017 956.50 -8.50 -0.88%
Soybeans Aug 2017 958.50 -8.50 -0.88%
Soybeans Sep 2017 955.50 -8.50 -0.88%
Soybeans Nov 2017 954.00 -7.75 -0.81%
Soybeans Jan 2018 960.75 -7.50 -0.77%
Soybean Meal May 2017 309.60 -3.90 -1.24%
Soybean Meal Jul 2017 313.70 -4.00 -1.26%
Soybean Meal Aug 2017 315.00 -4.10 -1.28%
Soybean Oil May 2017 31.91 +0.33 +1.04%
Soybean Oil Jul 2017 32.16 +0.31 +0.97%
Soybean Oil Aug 2017 32.25 +0.30 +0.94%
Corn May 2017 359.00 -6.00 -1.64%
Corn Jul 2017 366.75 -5.00 -1.34%
Corn Sep 2017 373.75 -5.00 -1.32%
Corn Dec 2017 384.25 -4.75 -1.22%
Corn Mar 2018 394.00 -4.50 -1.13%
Oats May 2017 220.75 -1.75 -0.79%
Oats Jul 2017 219.75 -1.75 -0.79%
Oats Sep 2017 217.25 -1.00 -0.46%
Oats Dec 2017 218.00 -1.50 -0.68%
Oats Mar 2018 225.75 -1.25 -0.55%
Wheat May 2017 407.75 -1.00 -0.24%
Wheat Jul 2017 426.50 -0.50 -0.12%
Wheat Sep 2017 439.25 -1.75 -0.40%
Wheat Dec 2017 462.00 -2.50 -0.54%
Wheat Mar 2018 481.25 -2.00 -0.41%
Minneapolis
Spring Wheat May 2017 537.75 +4.00 +0.75%
Spring Wheat Jul 2017 550.75 +6.25 +1.15%
Spring Wheat Sep 2017 557.00 +5.25 +0.95%
Spring Wheat Dec 2017 564.00 +4.00 +0.71%
Spring Wheat Mar 2018 571.75 +3.75 +0.66%
Kansas City
Hard Red Wheat May 2017 412.25 +0.25 +0.06%
Hard Red Wheat Jul 2017 425.25 +0.50 +0.12%
Hard Red Wheat Sep 2017 441.50 +0.75 +0.17%
Hard Red Wheat Dec 2017 466.75 +0.75 +0.16%
Hard Red Wheat Mar 2018 482.75 +0.75 +0.16%
Chicago livestock futures in US¢/pound (rounded to two decimal places)
Live Cattle (P) Apr 2017 132.02 +2.20 +1.69%
Live Cattle (P) Jun 2017 118.52 +2.69 +2.32%
Live Cattle (P) Aug 2017 114.78 +2.73 +2.44%
Feeder Cattle (P) Apr 2017 139.85 +1.13 +0.81%
Feeder Cattle (P) May 2017 142.08 +4.41 +3.20%
Feeder Cattle (P) Aug 2017 145.85 +4.50 +3.18%
Lean Hogs (P) May 2017 64.68 -0.54 -0.83%
Lean Hogs (P) Jun 2017 70.75 -1.08 -1.50%
Lean Hogs (P) Jul 2017 71.75 -1.10 -1.51%