WINNIPEG, (MarketsFarm) – Intercontinental Exchange (ICE) Futures canola contracts were steady to higher on Thursday, as bids continue to be range-bound.
That situation is very unlikely to change anytime soon, said a trader, adding two reports could provide the impetus to push canola prices up or down to a greater extent. The first will be the production estimates from Statistics Canada to be released August 28. The federal agency’s survey-based results could provide a clearer picture of this year’s canola production.
The second will be the next supply and demand report from the United States Department of Agriculture on September 12. Traders and farmers firmly believe the USDA overestimated its corn and soybean numbers. The September estimates could straighten that out.
Read Also
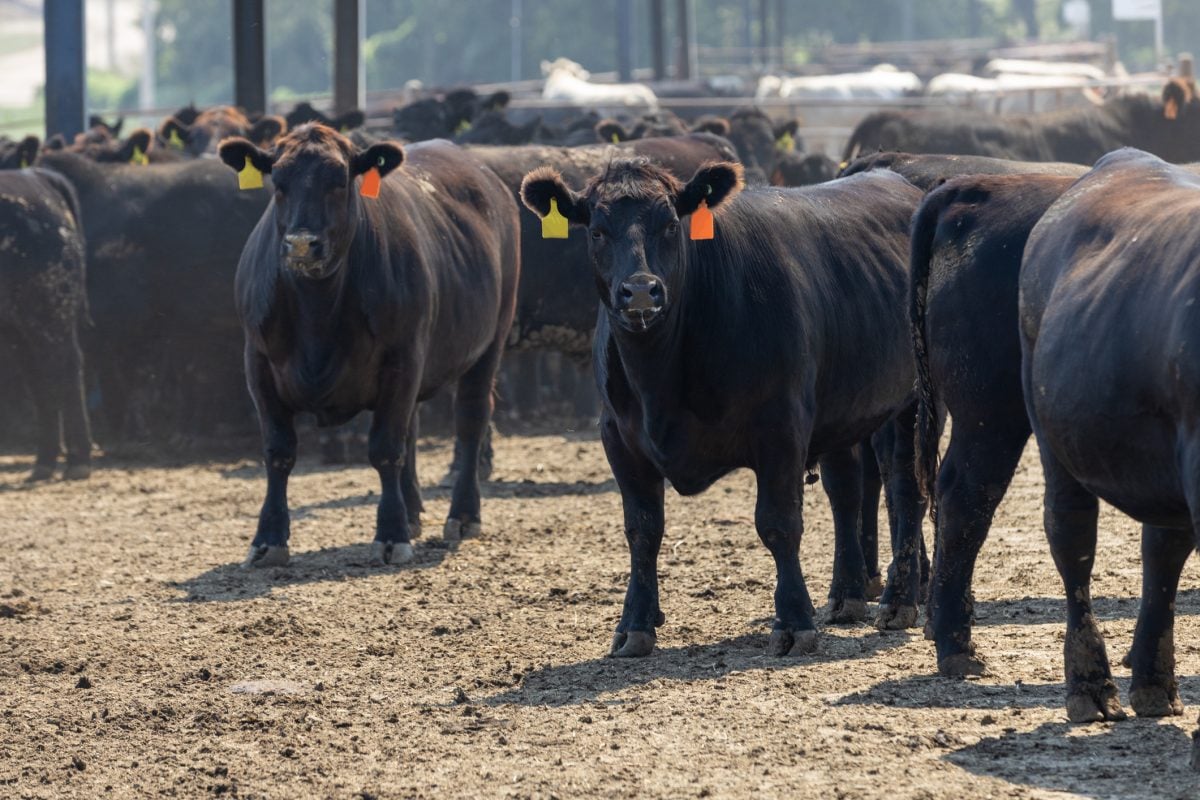
U.S. livestock: Feeder cattle hit contract highs on tight supply
Chicago | Reuters – All Chicago Mercantile Exchange feeder cattle futures and most live cattle futures hit contract highs on…
The wildcard in all this remains the threat of frost. Next week’s overnight temperatures on the Prairies were forecast to be in the single digits, raising the specter of frost. Any severe damage would force major revisions to crop estimates.
There were 17,459 contracts traded on Thursday, which compares with Wednesday when 13,019 contracts changed hands. Spreading accounted for 11,136 contracts traded.
Settlement prices are in Canadian dollars per metric tonne.
Price Change
Canola Nov 453.10 unchanged
Jan 461.10 up 0.60
Mar 468.10 up 1.30
May 473.80 up 1.50
SOYBEAN futures at the Chicago Board of Trade (CBOT) were weaker on Thursday, as the prospect of future exports weighed on values.
Although China purchased almost 75,600 tonnes of United States soybeans this week, the country has 50 vessels carrying Brazilian soybeans, with a dozen more cargoes locked in. The amounts were reportedly enough to take China into October before needing more soybeans.
The U.S. Department of Agriculture (USDA) released its weekly export sales report. Old crop soybeans came in at 25,900 tonnes, well within trade expectations. New crop soybeans totaled 792,600 tonnes, well above expectations.
The sales report listed soymeal exports at 118,600 tonnes, within market predictions. Soyoil was at 2,200 tonnes, less than half of expectations.
The Pro Farmer Midwest Crop Tour moved into its third day with the eastern leg in Illinois finding average soybean pod counts were more than 997 pods with three by three-foot squares in fields. Last year’s tour average was almost 1,329 pods. In Iowa, the western leg estimated average pod counts at 1,096, slightly above last year’s 1,082 pods.
CORN futures were firm on Thursday, on technical maneuvering and some positive feelings from export sales.
Export sales tallied 119,300 tonnes of old crop, which was within trade predictions and an increase from the previous week. New crop came in at 301,600 tonnes, also within estimates.
The Pro Farmer tour estimated corn yields in Illinois at 171.17 bushels per acre (BPA), down from last year’s estimate of 192.63. In Iowa, the tour projected corn yields above average.
The Trump administration has been getting backlash from the agricultural community over waivers handed to 31 oil refineries now exempt from requirements to blend corn-based ethanol with gasoline. Yesterday, POET and Marquis Energy announced their plants were either shutting down or scaling back production.
Ethanol production in Brazil has been estimated to jump by nearly 71 per cent in 2019/20. CONAB pegged production at almost 8.50 million barrels.
WHEAT futures were mixed on Thursday, due to technical maneuvering that resulted in gains for Chicago and Kansas City, but losses for Minneapolis.
The USDA reported export sales of 594,600 tonnes, which exceed market expectations. Sales increased 29 per cent over the previous week.
Saudi Arabia tendered a purchase for 780,000 tonnes of feed barley. The tender closes tomorrow.
Tunisia purchased 92,000 tons of soft milling wheat for delivery in September and October.
OUTSIDE MARKETS
Light crude oil nearby futures in New York was down 33 cents at US$55.35 per barrel.
In the afternoon, the Canadian dollar was trading around US75.23 cents, down from 75.31 cents the previous trading day. The U.S. dollar was C$1.3293.
Winnipeg ICE Futures Canada dollars per tonne.
Canola Nov 19 453.10s unch unch
Canola Jan 20 461.10s +0.60 +0.13%
Canola Mar 20 468.10s +1.30 +0.28%
Canola May 20 473.80s +1.50 +0.32%
Canola Jul 20 479.40s +1.70 +0.36%
American crop prices in cents US/bushel, soybean meal in $US/short ton, soy oil in cents US/pound. Prices are displayed with fractions (2/8, 4/8, and 6/8) instead of decimals. -2 equals .25, -4 equals .50, -6 equals .75. The “s” means it is the settlement.
Chicago
Soybean Sep 19 856-0s -4-4 -0.52%
Soybean Nov 19 868-6s -4-2 -0.49%
Soybean Jan 20 882-4s -4-2 -0.48%
Soybean Mar 20 895-4s -4-6 -0.53%
Soybean May 20 907-0s -4-6 -0.52%
Soybean Meal Sep 19 293.7s -1.0 -0.34%
Soybean Meal Oct 19 295.7s -0.9 -0.30%
Soybean Meal Dec 19 299.3s -1.0 -0.33%
Soybean Oil Sep 19 28.54s -0.20 -0.70%
Soybean Oil Oct 19 28.65s -0.22 -0.76%
Soybean Oil Dec 19 28.90s -0.22 -0.76%
Corn Sep 19 363-2s +0-6 +0.21%
Corn Dec 19 371-0s +0-6 +0.20%
Corn Mar 20 383-0s +0-4 +0.13%
Corn May 20 390-6s +0-4 +0.13%
Corn Jul 20 397-2s +0-4 +0.13%
Oats Sep 19 265-2s -6-2 -2.30%
Oats Dec 19 266-2s -4-0 -1.48%
Oats Mar 20 270-6s -3-6 -1.37%
Oats May 20 270-4s -3-2 -1.19%
Oats Jul 20 272-2s -3-2 -1.18%
Wheat Sep 19 467-2s +4-6 +1.03%
Wheat Dec 19 471-6s +3-6 +0.80%
Wheat Mar 20 477-6s +3-2 +0.68%
Wheat May 20 481-6s +2-4 +0.52%
Wheat Jul 20 485-6s +2-0 +0.41%
Minneapolis
Spring Wheat Sep 19 498-4s -3-6 -0.75%
Spring Wheat Dec 19 513-4s -1-4 -0.29%
Spring Wheat Mar 20 526-2s -3-0 -0.57%
Spring Wheat May 20 536-0s -3-0 -0.56%
Spring Wheat Jul 20 545-6s -2-6 -0.50%
Kansas City
Hard Red Wheat Sep 19 393-2s +7-0 +1.81%
Hard Red Wheat Dec 19 404-2s +3-6 +0.94%
Hard Red Wheat Mar 20 418-2s +3-0 +0.72%
Hard Red Wheat May 20 428-6s +3-0 +0.70%
Hard Red Wheat Jul 20 438-4s +2-4 +0.57%
Chicago livestock futures in US¢/pound, Pit trade
Live Cattle Aug 19 104.975s +2.300 +2.24%
Live Cattle Oct 19 101.100s +0.875 +0.87%
Live Cattle Dec 19 106.100s +0.800 +0.76%
Feeder Cattle Aug 19 138.400s +1.025 +0.75%
Feeder Cattle Sep 19 136.425s +1.125 +0.83%
Feeder Cattle Oct 19 135.475s +0.925 +0.69%
Lean Hogs Oct 19 62.300s -1.000 -1.58%
Lean Hogs Dec 19 61.550s -1.125 -1.79%
Lean Hogs Feb 20 68.575s -1.250 -1.79%