Canola edged higher Tuesday with support from soybeans and soy oil.
The drought-reduced canola crop supported the market but analysts are trying to assess how much good recent rain in the western Prairies will do for the crop.
Rain will likely help to lift canola yields from the low assessments of a couple of weeks ago because the crop can set new pods and flower, unlike cereals where the rain will only help to fill existing kernels.
The CWB crop tour began today. CWB staff, private analysts and reporters are on the three legs of the tour. A yield and production forecast will be released on Friday.
Read Also

U.S. livestock: Hog futures hit contract highs on shock herd decline
Chicago | Reuters – Lean hog futures stormed to contract highs at the Chicago Mercantile Exchange on Friday as smaller-than-expected…
Western Producer reporters and others are tweeting about the tour under the hashtag #cwbtour15. Our reporters are also filing to a live blog at Producer.com.
Several private forecasters have canola production estimates are roughly in the12.5 to 13.5 million tonne area. down from 15.56 million last year.
Today Agriculture Canada released its new monthly supply and demand report.
It now forecasts canola production at 14.3 million tonnes, down from 14.925 million in its June report.
It increased canola seeded acreage to reflect the latest Statistics Canada survey and lower the yield forecast to account for the dry weather in Saskatchewan and Alberta.
It reduced its forecast for canola exports and domestic use and kept its forecast for 2015-16 ending stocks at 500,000 tonnes.
Canola futures today enjoyed support from soybeans, which rose on bargain buying after five days of declines. Gains were limited by generally favourable growing conditions in the Midwest.
It was a similar story in the corn market.
Wheat futures were lower on expectations of ample world wheat supply and ideas that American wheat prices are significantly higher than Russian wheat.
However there are harvest reports from soft wheat fields in the eastern corn belt where repeated rains have severely downgraded the quality of some of the crop.
Light crude oil nearby futures in New York were up 21 cents to US$50.36 per barrel.
The Canadian dollar at noon was US77.15 cents, up from 77.03 cents the previous trading day. The U.S. dollar at noon was C$1.2961.
The Dow Jones industrial average fell 179.95 points, or 0.99 percent, to 17,920.46, the S&P 500 lost 9.08 points, or 0.43 percent, to 2,119.2 and the Nasdaq Composite dropped 10.74 points, or 0.21 percent, to 5,208.12.
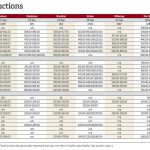
Winnipeg ICE Futures Canada dollars per tonne
Canola Nov 2015 519.80 +2.90 +0.56%
Canola Jan 2016 520.50 +3.70 +0.72%
Canola Mar 2016 517.40 +4.30 +0.84%
Canola May 2016 513.30 +5.20 +1.02%
Canola Jul 2016 507.60 +5.60 +1.12%
Milling Wheat Oct 2015 228.00 -1.00 -0.44%
Milling Wheat Dec 2015 228.00 -1.00 -0.44%
Milling Wheat Mar 2016 232.00 -1.00 -0.43%
Durum Wheat Oct 2015 335.00 unch 0.00%
Durum Wheat Dec 2015 345.00 unch 0.00%
Durum Wheat Mar 2016 360.00 unch 0.00%
Barley Oct 2015 217.40 unch 0.00%
Barley Dec 2015 218.10 unch 0.00%
Barley Mar 2016 220.10 unch 0.00%
American crop prices in cents US/bushel, soybean meal in $US/short ton, soy oil in cents US/pound
Chicago
Soybeans Aug 2015 1018.75 +11 +1.09%
Soybeans Sep 2015 1006.5 +8.25 +0.83%
Soybeans Nov 2015 1004.75 +5.25 +0.53%
Soybeans Jan 2016 1010.75 +5.25 +0.52%
Soybeans Mar 2016 1004.75 +4.5 +0.45%
Soybeans May 2016 995.25 +3.25 +0.33%
Soybean Meal Aug 2015 359.9 +3.9 +1.10%
Soybean Meal Sep 2015 351.6 +3.1 +0.89%
Soybean Meal Oct 2015 345.9 +2.4 +0.70%
Soybean Oil Aug 2015 31.93 +0.25 +0.79%
Soybean Oil Sep 2015 32.02 +0.24 +0.76%
Soybean Oil Oct 2015 32.12 +0.26 +0.82%
Corn Sep 2015 406.5 +1.5 +0.37%
Corn Dec 2015 417.5 +1.5 +0.36%
Corn Mar 2016 427.75 +1.5 +0.35%
Corn May 2016 433.75 +1.5 +0.35%
Corn Jul 2016 438.5 +1.75 +0.40%
Oats Sep 2015 240 -1.25 -0.52%
Oats Dec 2015 253.25 -0.25 -0.10%
Oats Mar 2016 264.75 -2.75 -1.03%
Oats May 2016 267.75 unch 0.00%
Oats Jul 2016 268.75 unch 0.00%
Wheat Sep 2015 524.75 -8 -1.50%
Wheat Dec 2015 533.25 -9.25 -1.71%
Wheat Mar 2016 541.5 -10.25 -1.86%
Wheat May 2016 546.25 -10.25 -1.84%
Wheat Jul 2016 547.75 -9.5 -1.70%
Minneapolis
Spring Wheat Sep 2015 556.5 -2.5 -0.45%
Spring Wheat Dec 2015 574.5 -1.5 -0.26%
Spring Wheat Mar 2016 590 -1 -0.17%
Spring Wheat May 2016 600 -0.5 -0.08%
Spring Wheat Jul 2016 605.5 -1.25 -0.21%
Kansas City
Hard Red Wheat Sep 2015 518 -7.5 -1.43%
Hard Red Wheat Dec 2015 537.75 -7.5 -1.38%
Hard Red Wheat Mar 2016 552 -7.5 -1.34%
Hard Red Wheat May 2016 560.75 -7.5 -1.32%
Hard Red Wheat Jul 2016 567 -7.5 -1.31%


