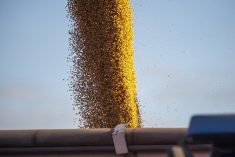
Canola and all other crops soared Friday on support from a USDA report that was particularly bullish for oilseeds.
May canola closed at $622.50 per tonne, up $19.20.
November closed at $575.20, up $19.20.
For the week, May was up $24 per tonne and November climbed $16.10.
The report was bullish for old crop corn but less so for new crop corn. Wheat prices rose on a surprisingly small spring wheat acreage number in the report.
The report showed a lot land in the Dakotas will come out of wheat and go into corn and soybeans.
Read Also

Feed grains: Australia looking at another large barley export program
Australia’s 2025/26 barley harvest is underway and early expectations for a record should see the country as an active participant in the world export market going forward.
But overall, USDA pegged soybean acreage at just 73.902 million acres, down one percent from last year.
The trade, as polled by Reuters, had expected 75.393 million.
USDA pegged corn area at 95.864 million acres, up four percent from last year and the most in 75 years.
Analysts polled by Reuters had expected farmers to plant 94.72 million acres of corn.
The USDA polled farmers a few weeks ago and since then soybean prices have gained on corn so final planting numbers could be different from this early look. With soybean’s rally in March, the corn-to-soybean price ratio now stands at 2.51-to-1, a level that gives soybeans a slight edge over corn. However, the unusually warm spring in the Midwest means corn planting is already starting.
On the face of it, a larger than expected corn acreage number should have weakened new crop prices, but USDA’s March 1 stocks number was about 150 million bushels less than expected. Growers would need seed close to a million acres to replace that corn.
In its quarterly grains stocks report, the USDA said corn supplies as of March 1 stood at 6.009 billion bushels, below trade estimates for 6.150 billion. Remember, last year at this time the stocks number was eight percent larger and that caused panic.
Soybean stocks were put at 1.372 billion bu., below estimates for 1.387 billion bu.
All wheat stocks were put at 1.2 billion bu., down from 1.425 billion last year at the same time and below the trade guess of 1.223 billion.
Spring wheat seeded area was pegged at 11.976 million acres, much less than the trade estimate of 13.313 million.
Durum area, USDA said, would be 2.223 million acres, up 62 per cent from last year when excess moisture prevented planting. However, the number was spot on the trade’s expectations. Also, it was still shy of the 2.56 million acres seeded in 2010.
U.S. farmers plan to seed 1.557 million acres of canola, up 45 percent from last year’s wet spring, but up only about seven percent from two years ago. Most of the gains are in Oklahoma which is trying out winter canola.
USDA sees oats acres up 15 percent from last year at 2.863 million acres and barley up 30 percent at 3.333 million. In 2010 barley area was 2.872 million acres and oats area was 3.138 million.
Flax area is expected to rise to 289,000 acres from 178,000 last year, but two years ago the area was 421,000 acres.
Oil sunflower area is expected to be up 19 percent to 1.537 million acres and non oil sunflowers are up seven percent to 271,500 acres.
Lentil area is expected to climb 21 percent to 518,000 acres, but that is down from the number two years ago of 658,000 acres.
Pea area is expected to climb 71 percent to 619,000 acres, but that is down from two years ago when seed area was 756,000 acres.
• The Canadian Oilseed Processors Association said members crushed 151,522 tonnes of canola in the week ending March 25, an increase of 2.2 percent over the week before. That represented a crush capacity use of 91 percent.
Winnipeg (per tonne)
Canola May 12 $622.50, up $19.20 +3.18%
Canola Jul 12 $619.90, up $18.70 +3.11%
Canola Nov 12 $575.20, up $19.20 +3.45%
Canola Jan 13 $578.90, up $18.70 +3.34%
The basis for the par region was not available.
The 14-day relative strength index was 77.
Western Barley May 12 $229.00, unchanged
Western Barley Jul 12 $232.00, unchanged
Milling Wheat Oct 12 $270.00, up 9.50 +3.65%
Milling Wheat Dec 12 $275.00, up 9.50 +3.58%
Milling Wheat Mar 13 $280.00, up 9.50 +3.51%
Durum Wheat Oct 12 $275.00, unchanged
Durum Wheat Dec 12 $279.50, unchanged
Durum Wheat Mar 13 $286.10, unchanged
Barley Oct 12 $186.50, up $1.50 +0.81%
Barley Dec 12 $190.00, up $1.50 +0.80%
Barley Mar 13 $191.50, up $1.50 +0.79%
Chicago (per bushel)
Soybeans May 12 $14.03, up 47.5 cents +3.50%
Soybeans Jul 12 $14.0825, up 47.0 +3.45%
Soybeans Nov 12 $13.58, up 53.25 +4.08%
Corn May 12 $6.44, up 40.0 +6.62%
Corn Jul 12 $6.4325, up 39.5 +6.54%
Corn Dec 12 $5.4025, up 16.0 +3.05%
Oats May 12 $3.4125, up 5.75 +1.71%
Oats Jul 12 $3.42, up 6.75 +2.01%
Oats Dec 12 $3.44, up 5.75 +1.70%
Minneapolis (per bushel)
Spring Wheat May 12 $8.375, up 48.75 cents +6.18%
Spring Wheat Jul 12 $8.335, up 50.5 +6.45%
Spring Wheat Sep 12 $8.215, up 51.5 +6.69%
Spring Wheat Dec 12 $8.22, up 48.25 +6.24%
The nearby New York light sweet crude contract rose 24 cents to $103.02.
The Canadian dollar at noon was $1.0009 US, little changed from $1.0001 the previous trading day. The U.S. dollar at noon was 0.9991 Cdn.
The Toronto Stock Exchange’s S&P/TSX composite index rose 52.82 points, or 0.43 percent, to close unofficially at 12,392.18.
The Dow Jones industrial average jumped 66.22 points, or 0.50 percent, to end unofficially at 13,212.04.
The Standard & Poor’s 500 Index gained 5.19 points, or 0.37 percent, to finish unofficially at 1,408.47.
The Nasdaq Composite Index dipped 3.79 points, or 0.12 percent, to close unofficially at 3,091.57.
For the week, the TSX was down 0.6 percent, Dow was up one percent, the S&P 500 was up 0.8 percent and the Nasdaq rose 0.8 percent.
For the quarter, the Dow rose 8.1 percent, the S&P 500 climbed 12 percent and the Nasdaq jumped 18.7 percent.