Canola future edged lower Thursday even though there was modest support from soybeans and soy oil, which closed slightly higher.
Trade volume was light and there was little news to trade on.
Most of the grain felt in Alberta and Saskatchewan is enjoying double digit temperatures, although it is cooler in Manitoba.
The 14-day forecast from the Weather Network for Saskatoon now shows almost no chance of precipitation through to the end of the forecast Nov. 17.
WATCH THIS WEEK’S VIDEO CROP MARKETS UPDATE
Read Also
U.S. grains: soybeans firm ahead of USDA data
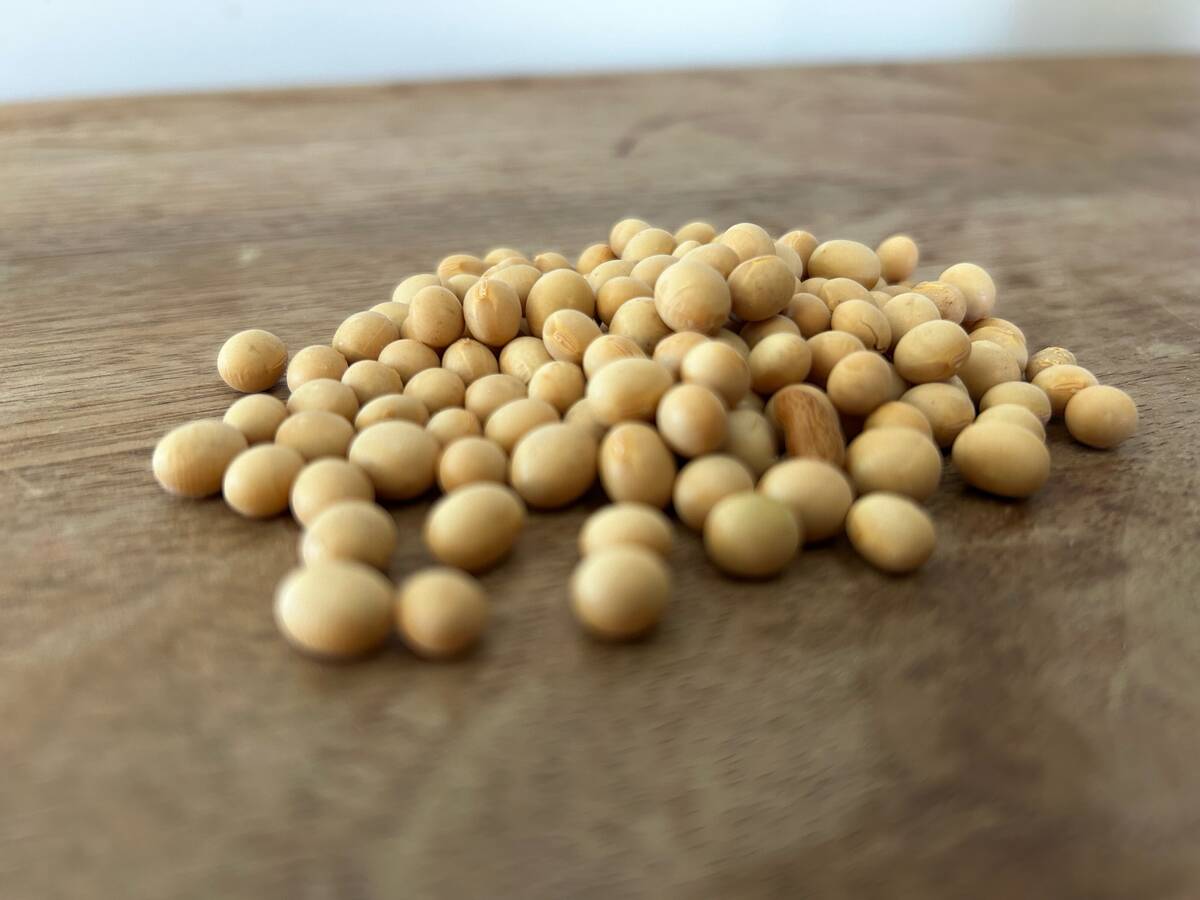
Chicago soybeans ticked up slightly on Wednesday as traders adjusted positions ahead of the release of official U.S. data on global supply and demand on Friday, the first update in weeks, but prices were capped by a lack of large Chinese purchases.
In the American crop market, the trade was watching weekly export numbers and new private forecaster estimates of the U.S. corn and soybean crops.
The weekly USDA export sales report said soybean sales were 2.5 million tonnes and corn sales were 1.47 million tonnes. Both beat analyst estimates.
Wheat export sales of 234,900 tonnes fell below expectations and were the lowest so far during the marketing year that started June 1.
Markets generally remain on edge in advance of next Tuesday’s American election.
The crop market is also adjusting positions in advance of Wednesday’s monthly USDA supply and demand report.
Informa Economics, a private analytics firm, on Thursday raised its estimate of the U.S. 2016 soybean yield to 52.4 bushels per acre (bpa), from 51.6 last month, three trade sources said.
It pegged U.S. soybean production at 4.353 billion bushels,
The current USDA estimate is 4.269 billion bushels with a yield of 51.4 bpa.
Informa lowered its U.S. corn yield estimate to 174 bpa, from 174.5 bpa on Oct. 5. It expects the corn crop will be 15.109 billion bu., down from 15.215 billion in October.
The current USDA estimate is 15.057 billion bu. with a yield of 173.4 bpa
Fertilizer maker CF Industries yesterday forecast that American corn area in 2017 would plunge to 88 million acres from 94.5 million this year because of weak profitability
A few weeks ago Informa Economics forecast U.S. corn seeding would fall to 90.971 million acres. It forecast soybean area would jump to a new record 88.49 million acres, from 83.7 million this spring.
Warning from Facebook of weaker revenue growth this quarter weighed down U.S. stock indexes
The S&P 500 fell 9.28 points, or 0.44 percent, to 2,088.66 and the Nasdaq Composite dropped 47.16 points, or 0.92 percent, to 5,058.41.
The Dow Jones industrial average, which does not include Facebook among its components, fell 28.97 points, or 0.16 percent, to 17,930.67.
The Toronto Stock Exchange’s S&P/TSX composite index fell 11.30 points, or 0.08 percent, at 14,583.42.
Light crude oil nearby futures in New York were down 68 cents to US$44.66 per barrel.
The Canadian dollar at noon was US74.70 cents, down from 74.68 cents the previous trading day. The U.S. dollar at noon was C$1.3386.
Winnipeg ICE Futures Canada dollars per tonne
Canola Nov 16 507.20s -3.00 -0.59%
Canola Jan 17 514.20s -1.60 -0.31%
Canola Mar 17 518.50s -1.80 -0.35%
Canola May 17 520.20s -2.30 -0.44%
Canola Jul 17 519.10s -2.80 -0.54%
Milling Wheat Dec 16 224.00s -3.00 -1.32%
Milling Wheat Mar 17 229.00s -2.00 -0.87%
Milling Wheat May 17 233.00s -2.00 -0.85%
Durum Wheat Dec 16 320.00s unch unch
Durum Wheat Mar 17 324.00s unch unch
Durum Wheat May 17 328.00s unch unch
Barley Dec 16 132.50s unch unch
Barley Mar 17 134.50s unch unch
Barley May 17 135.50s unch unch
American crop prices in cents US/bushel, soybean meal in $US/short ton, soy oil in cents US/pound
Chicago
Soybeans Nov 2016 979.75 +3.00 +0.31%
Soybeans Jan 2017 989.50 +3.00 +0.30%
Soybeans Mar 2017 996.25 +2.75 +0.28%
Soybeans May 2017 1003.00 +2.75 +0.27%
Soybeans Jul 2017 1007.75 +2.25 +0.22%
Soybeans Aug 2017 1006.25 +2.25 +0.22%
Soybean Meal Dec 2016 306.40 -0.30 -0.10%
Soybean Meal Jan 2017 308.20 -0.10 -0.03%
Soybean Meal Mar 2017 309.80 +0.10 +0.03%
Soybean Oil Dec 2016 35.10 +0.12 +0.34%
Soybean Oil Jan 2017 35.36 +0.15 +0.43%
Soybean Oil Mar 2017 35.54 +0.14 +0.40%
Corn Dec 2016 348.00 +1.75 +0.51%
Corn Mar 2017 357.00 +1.50 +0.42%
Corn May 2017 364.25 +1.25 +0.34%
Corn Jul 2017 371.75 +1.75 +0.47%
Corn Sep 2017 378.00 +1.50 +0.40%
Oats Dec 2016 222.00 -2.50 -1.11%
Oats Mar 2017 219.25 +1.25 +0.57%
Oats May 2017 218.50 unch 0.00%
Oats Jul 2017 221.75 -0.25 -0.11%
Oats Sep 2017 217.00 -0.25 -0.12%
Wheat Dec 2016 412.00 -5.75 -1.38%
Wheat Mar 2017 429.75 -4.75 -1.09%
Wheat May 2017 445.00 -4.00 -0.89%
Wheat Jul 2017 458.50 -3.50 -0.76%
Wheat Sep 2017 474.25 -2.25 -0.47%
Minneapolis
Spring Wheat Dec 2016 509.75 -7.50 -1.45%
Spring Wheat Mar 2017 517.50 -6.75 -1.29%
Spring Wheat May 2017 525.50 -6.75 -1.27%
Spring Wheat Jul 2017 532.50 -6.50 -1.21%
Spring Wheat Sep 2017 540.75 -6.25 -1.14%
Kansas City
Hard Red Wheat Dec 2016 410.50 -5.00 -1.20%
Hard Red Wheat Mar 2017 428.50 -4.75 -1.10%
Hard Red Wheat May 2017 440.75 -4.50 -1.01%
Hard Red Wheat Jul 2017 452.25 -4.50 -0.99%
Hard Red Wheat Sep 2017 467.00 -4.25 -0.90%
Chicago livestock futures in US¢/pound (rounded to two decimal places)
Live Cattle (P) Dec 2016 104.08 -1.30 -1.23%
Live Cattle (P) Feb 2017 105.28 -1.02 -0.96%
Live Cattle (P) Apr 2017 105.10 -1.03 -0.97%
Feeder Cattle (P) Nov 2016 125.85 -0.73 -0.58%
Feeder Cattle (P) Jan 2017 118.75 -2.18 -1.80%
Feeder Cattle (P) Mar 2017 115.95 -1.97 -1.67%
Lean Hogs (P) Dec 2016 47.00 -0.83 -1.74%
Lean Hogs (P) Feb 2017 53.50 -0.50 -0.93%
Lean Hogs (P) Apr 2017 60.90 -0.23 -0.38%