The weaker Canadian dollar and concerns about the size of the Canadian canola crop helped canola futures edge higher for a second day, even though U.S. crop futures generally were lower.
The Canadian dollar fell below US77 cents, a six-year low.
The CWB prairie crop tour is in its second day. It winds up on Friday and will produce production estimates for canola, wheat and other crops.
Canola is suffering under hot temperatures this week. Although there could always be thunderstorms, it looks like the next chance for a wide spread rain is early next week with Saskatchewan’s northern grain belt and Manitoba the most likely to get rain.
Read Also
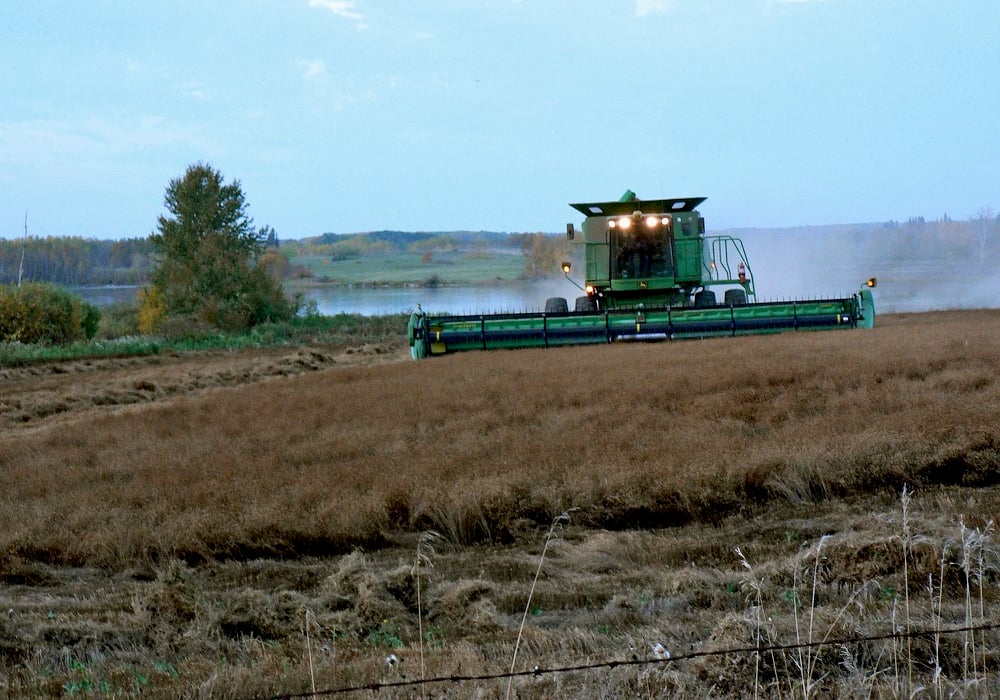
Most of Manitoba harvest wraps up for 2025
Manitoba Agriculture issued its final crop report of 2025, showing the overall provincewide harvest at 97 per cent complete as of Oct. 20. Nearly all major crops have finished combining, with 37 per cent of Manitoba’s sunflowers finished, plus 71 per cent of grain corn and small amounts of soybeans and potatoes left to do.
Soybean futures were mixed. The nearby contract firmed on support from strength in the cash market, where farmer selling has dried up, causing processors to boost their bids.
Deferred soybean contracts fell on improving crop conditions as fields in the eastern Midwest dried out.
“There is generally a favorable weather forecast and stable crop conditions holding yield potential a little higher than the market thought a few weeks ago, Greg Grow, director of agribusiness at Archer Financial Services, told Reuters.
Corn futures fell, pressured by good weather for crop development across the U.S. Midwest, Reuters reported.
The benign conditions also weighed on wheat, which eased as the pace of harvest in eastern growing areas increased.
Corn around the Midwest was passing through its yield-determining pollination phase in near ideal conditions in many areas, with mild temperatures putting little stress on the crop.
“The lack of more notable heat will keep crop development favorable in all but far southwest sections of the belt,” forecaster Commodity Weather Group said in a note.
The front-month Chicago wheat contract, which has fallen for seven days in a row, hit its lowest since June 25.
“The good weather prospects in the United States grain belts are again dominating the wheat and corn markets today, continuing the recent price weakness,” said Frank Rijkers, agrifood economist at ABN AMRO Bank.
Light crude oil nearby futures in New York were down $1.67 to US$49.19 per barrel.
The Canadian dollar at noon was US76.77cents, down from 77.15 cents the previous trading day. The U.S. dollar at noon was C$1.3026.
The Toronto Stock Exchange’s S&P/TSX composite index finished down 69.12 points, or 0.48 percent, at 14,307.12.
The Dow Jones industrial average fell 68.25 points, or 0.38 percent, to 17,851.04, the S&P 500 lost 5.06 points, or 0.24 percent, to 2,114.15 and the Nasdaq Composite dropped 36.35 points, or 0.7 percent, to 5,171.77.
Winnipeg ICE Futures Canada dollars per tonne
Canola Nov 2015 520.80 +1.00 +0.19%
Canola Jan 2016 521.20 +0.70 +0.13%
Canola Mar 2016 518.00 +0.60 +0.12%
Canola May 2016 514.00 +0.70 +0.14%
Canola Jul 2016 508.00 +0.40 +0.08%
Milling Wheat Oct 2015 225.00 -3.00 -1.32%
Milling Wheat Dec 2015 225.00 -3.00 -1.32%
Milling Wheat Mar 2016 229.00 -3.00 -1.29%
Durum Wheat Oct 2015 335.00 unch 0.00%
Durum Wheat Dec 2015 345.00 unch 0.00%
Durum Wheat Mar 2016 360.00 unch 0.00%
Barley Oct 2015 217.40 unch 0.00%
Barley Dec 2015 218.10 unch 0.00%
Barley Mar 2016 220.10 unch 0.00%
American crop prices in cents US/bushel, soybean meal in $US/short ton, soy oil in cents US/pound
Chicago
Soybeans Aug 2015 1020.75 +2 +0.20%
Soybeans Sep 2015 999.5 -7 -0.70%
Soybeans Nov 2015 995.5 -9.25 -0.92%
Soybeans Jan 2016 1001 -9.75 -0.96%
Soybeans Mar 2016 994.5 -10.25 -1.02%
Soybeans May 2016 985 -10.25 -1.03%
Soybean Meal Aug 2015 363.5 +3.6 +1.00%
Soybean Meal Sep 2015 353.2 +1.6 +0.46%
Soybean Meal Oct 2015 345.3 -0.6 -0.17%
Soybean Oil Aug 2015 31.35 -0.58 -1.82%
Soybean Oil Sep 2015 31.42 -0.6 -1.87%
Soybean Oil Oct 2015 31.51 -0.61 -1.90%
Corn Sep 2015 402.75 -3.75 -0.92%
Corn Dec 2015 413.5 -4 -0.96%
Corn Mar 2016 423.5 -4.25 -0.99%
Corn May 2016 429.25 -4.5 -1.04%
Corn Jul 2016 433.75 -4.75 -1.08%
Oats Sep 2015 236.25 -3.75 -1.56%
Oats Dec 2015 249 -4.25 -1.68%
Oats Mar 2016 260 -4.75 -1.79%
Oats May 2016 264.5 -3.25 -1.21%
Oats Jul 2016 265.5 -3.25 -1.21%
Wheat Sep 2015 516.75 -8 -1.52%
Wheat Dec 2015 524.5 -8.75 -1.64%
Wheat Mar 2016 531.75 -9.75 -1.80%
Wheat May 2016 536.5 -9.75 -1.78%
Wheat Jul 2016 538.75 -9 -1.64%
Minneapolis
Spring Wheat Sep 2015 548 -8.5 -1.53%
Spring Wheat Dec 2015 565.25 -9.25 -1.61%
Spring Wheat Mar 2016 580.75 -9.25 -1.57%
Spring Wheat May 2016 591 -9 -1.50%
Spring Wheat Jul 2016 598.25 -7.25 -1.20%
Kansas City
Hard Red Wheat Sep 2015 512.25 -5.75 -1.11%
Hard Red Wheat Dec 2015 532.25 -5.5 -1.02%
Hard Red Wheat Mar 2016 546.75 -5.25 -0.95%
Hard Red Wheat May 2016 555.5 -5.25 -0.94%
Hard Red Wheat Jul 2016 562.75 -4.25 -0.75%