Canola futures prices crawled a bit higher Monday, keeping with a general trend that has governed the crop for a month.
“We’ve been grinding higher and pushing up against resistance on the July (contract),” said Jon Driedger, analyst with FarmLink Marketing.
After the heady March to mid-May rally, canola prices have been bouncing around, repeatedly flirting with the $530 per tonne mark.
As the bouncing has gone on, the lows have been rising, revealing some strength but still lacking a decisive direction, with multiple supply and demand factors at play.
Read Also

American agriculture groups call for full renewal of CUSMA trade deal
American food and agriculture groups are calling for a full 16-year renewal of the Canada-United States-Mexico-Agreement (CUSMA).
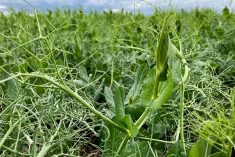
The crop looks good across Western Canada, but it is early and many variables could change that.
Soybeans have surged so far in June, driven by meal demand, with canola following much less confidently.
Canola stocks are tight.
China’s planned restrictions on dockage might prompt exporters to hold off on commitments.
Crusher demand is good.
Canola is holding a mixed bag of factors.
“It lends itself to rangebound but with a firmer tone, until something causes us to break out one way or the other,” said Driedger.
Monday soybean meal, soybean oil and soybeans all fell, so the rise in canola revealed a bit of underlying strength.
Some U.S. traders and analysts think the U.S. Department of Agriculture might raise soybean acreage estimates.
Oats and corn rose as traders speculated on the possible impact of hot weather in the U.S. South. Patches of dryness also pushed up corn prices.
Wheat fell as winter wheat harvest in the U.S. proceeds and ample world stocks create a heavy-looking situation. Spring wheat fared better, fending off a decline.
Contact ed.white@producer.com
Light crude oil nearby futures in New York were down 19 cents to US$48.88 per barrel.
The Canadian dollar at noon was US78.17 cents, down from 78.52 cents the previous trading day. The U.S. dollar at noon was C$1.2792.
Winnipeg ICE Futures Canada dollars per tonne
Canola Jul 2016 526.90 +3.40 +0.65%
Canola Nov 2016 529.10 +3.60 +0.69%
Canola Jan 2017 533.80 +3.80 +0.72%
Canola Mar 2017 535.70 +3.80 +0.71%
Canola May 2017 537.30 +3.60 +0.67%
Milling Wheat Jul 2016 236.00 unch 0.00%
Milling Wheat Oct 2016 233.00 unch 0.00%
Durum Wheat Jul 2016 300.00 unch 0.00%
Durum Wheat Oct 2016 298.00 unch 0.00%
Barley Jul 2016 171.50 unch 0.00%
Barley Oct 2016 171.50 unch 0.00%
American crop prices in cents US/bushel, soybean meal in $US/short ton, soy oil in cents US/pound
Chicago
Soybeans Jul 2016 1169.00 -8.00 -0.68%
Soybeans Aug 2016 1169.00 -7.50 -0.64%
Soybeans Sep 2016 1162.75 -5.75 -0.49%
Soybeans Nov 2016 1159.00 -3.75 -0.32%
Soybeans Jan 2017 1156.25 -2.50 -0.22%
Soybeans Mar 2017 1115.50 -1.00 -0.09%
Soybean Meal Jul 2016 408.40 -5.00 -1.21%
Soybean Meal Aug 2016 408.40 -3.40 -0.83%
Soybean Meal Sep 2016 408.40 -2.40 -0.58%
Soybean Oil Jul 2016 32.51 -0.33 -1.00%
Soybean Oil Aug 2016 32.65 -0.32 -0.97%
Soybean Oil Sep 2016 32.79 -0.32 -0.97%
Corn Jul 2016 430.00 +6.00 +1.42%
Corn Sep 2016 435.50 +7.00 +1.63%
Corn Dec 2016 440.00 +8.25 +1.91%
Corn Mar 2017 445.25 +9.00 +2.06%
Corn May 2017 448.25 +9.25 +2.11%
Oats Jul 2016 205.25 +4.50 +2.24%
Oats Sep 2016 216.25 +3.75 +1.76%
Oats Dec 2016 227.00 +2.75 +1.23%
Oats Mar 2017 238.00 +3.00 +1.28%
Oats May 2017 238.00 +3.75 +1.60%
Wheat Jul 2016 491.25 -4.25 -0.86%
Wheat Sep 2016 503.25 -3.00 -0.59%
Wheat Dec 2016 523.25 -2.00 -0.38%
Wheat Mar 2017 542.75 +0.50 +0.09%
Wheat May 2017 554.75 +0.50 +0.09%
Minneapolis
Spring Wheat Jul 2016 540.25 +6.00 +1.12%
Spring Wheat Sep 2016 550.00 +7.25 +1.34%
Spring Wheat Mar 2017 579.25 +7.50 +1.31%
Spring Wheat May 2017 586.75 -6.75 -1.14%
Kansas City
Hard Red Wheat Jul 2016 460.75 -7.75 -1.65%
Hard Red Wheat Sep 2016 478.25 -7.50 -1.54%
Hard Red Wheat Dec 2016 503.00 -7.25 -1.42%
Hard Red Wheat Mar 2017 518.75 -7.00 -1.33%
Hard Red Wheat May 2017 529.25 -9.50 -1.76%
Live Cattle (P) Jun 2016 119.45 -2.77 -2.27%
Live Cattle (P) Aug 2016 114.35 -3.17 -2.70%
Live Cattle (P) Oct 2016 113.80 -3.12 -2.67%
Feeder Cattle (P) Aug 2016 141.05 -4.23 -2.91%
Feeder Cattle (P) Sep 2016 139.70 -4.32 -3.00%
Feeder Cattle (P) Oct 2016 138.15 -4.47 -3.13%
Lean Hogs (P) Jun 2016 81.82 -0.50 -0.61%
Lean Hogs (P) Jul 2016 86.10 +0.38 +0.44%
Lean Hogs (P) Aug 2016 87.82 +1.10 +1.27%